Following the surprise, albeit much needed, announcement of a UK general election, I’ve not been able to resist hoovering up any and all available data on the political dynamics of the situation.
In terms of voting intentions, it’s a vastly different situation to any seen within the last quarter of a century or so. Labour have consistently been maintaining a pretty huge lead over our current ruling party, the Conservatives – around 20 points ahead at the time of writing. After all, the Conservatives have the minds of many of us – as well as in many datasets – have left the country in a significantly worse state than when they took over in 2010. Which feels like a very long and painful time ago.
But the magnitude of that lead differs by the demographic of the voters concerned. It’s perhaps on the dimension of age that these differences appear at their most extreme. Younger people – and the definition of young can be quite expansive and this still holds – report being extremely, perhaps unprecedentedly, unlikely to vote for the Conservatives.
This may be no great surprise to anyone who’s followed the recent policies being spouted out by our current leaders on a regular basis. At times it genuinely feels like they are trying to stoke some kind of generational war. Counterproductive mandatory national service for our youth. A generous “triple lock plus” pension deal for our older, often richer, citizens. The refusal to even discuss the EU-offered opportunity to make it easier for the young to work and study in their territory. And so it goes on.
I recently read an edition of Ben Ansell’s newsletter “Political Calculus” which often provides some interesting facts and figures on this topic. He’s the author of a book called “Why Politics Fails”, which I intend to read at some point. In that edition of his newsletter though he amasses some data that shows that, no matter what the reason might be, if the Conservatives are trying to win older voters at the expense of younger it’s certainly paying off. Well, at least the “make young people hate you” side of it is.
Ansell highlights the results of a Yougov poll done at the end of May 2024 that showed the rather remarkable result that only 8% of voters under the age of 50 intend to vote for Conservatives.
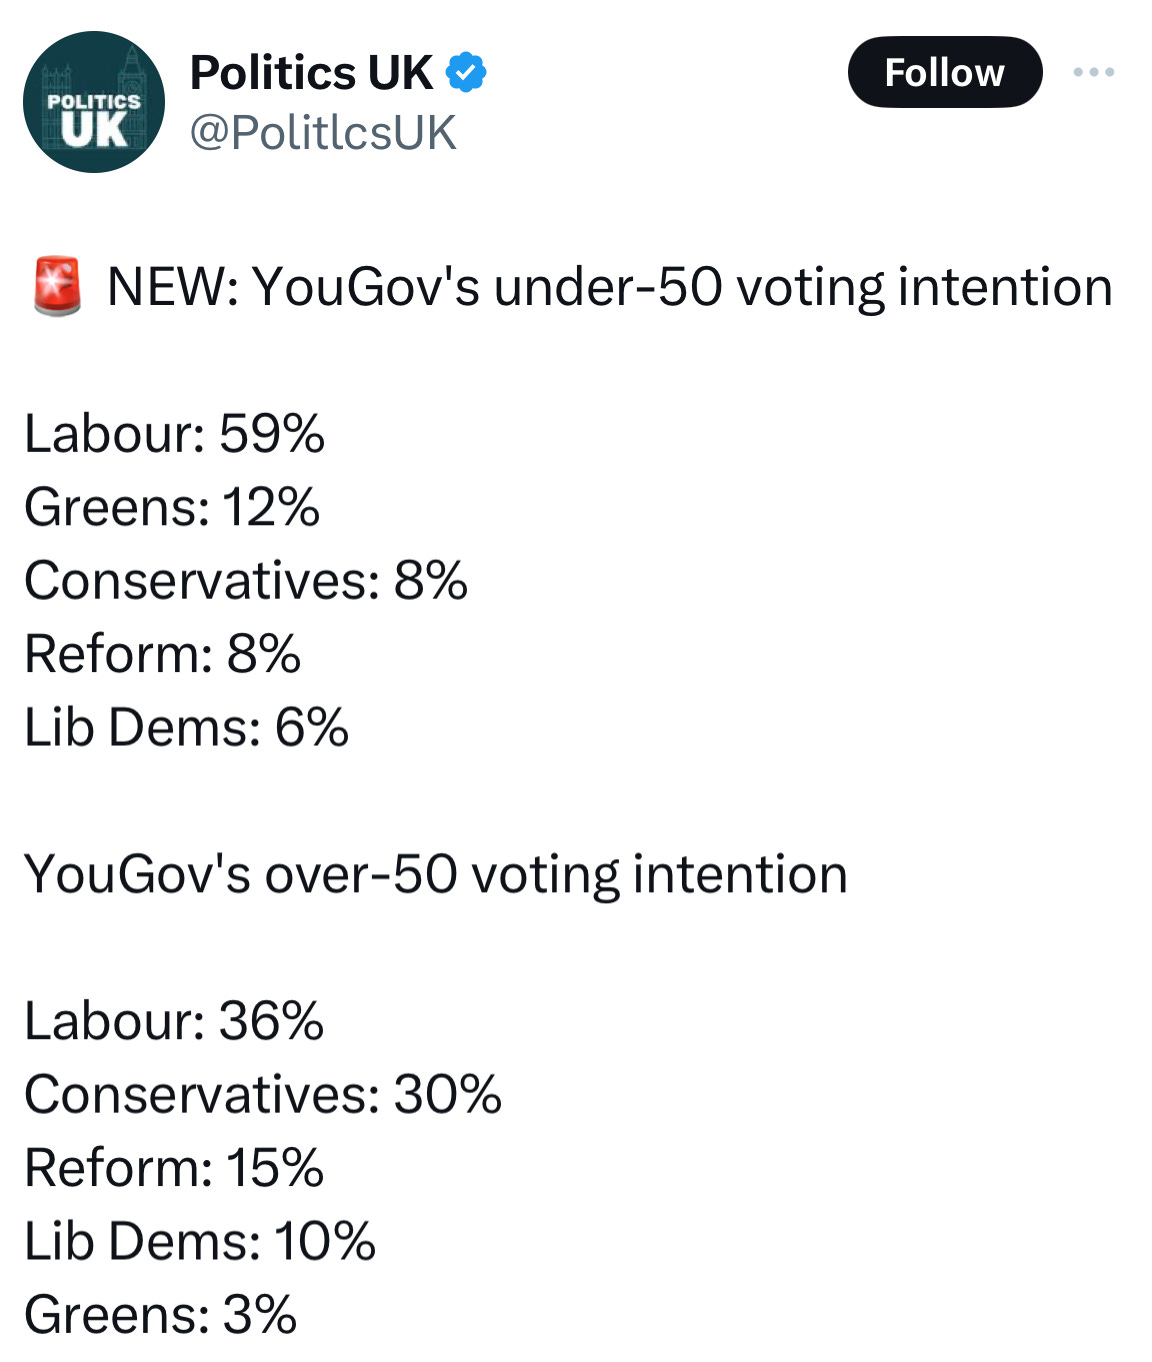
8%! Everyone under 50! That puts them in third place, with the Greens coming second at 12%. Maybe there is hope for us and our planet after all.
Defining young as being under 50 is rather generous (not to look a gift horse in the mouth). Amongst the actually-young, the figures are even more stark. The full breakdown of the poll concerned shows that just 4% of 18-24 year olds are intending to vote Conservative, vs five times as many going Green.
The tendency for older people to be more likely to vote Conservative has existed for at least several decades. Some previous work by Ansell and Gingrich for the Institute of Fiscal Studies attempted to estimate the association between your age and your likelihood to vote for the Conservatives over time since the 1960s.
It netted out such that until very recently every decade of extra age you had was associated with a 3 percent increase in the chance you’d vote Conservative. But in 2017 – coincidentally or not, the post-Brexit elections – the size of the difference shot up, more than doubling to something nearer a seven percent chance you’d vote Conservative for every extra decade of age you were.

Recently, John Burn-Murdoch looked into the issue of why young people have developed such a distaste for voting Conservative in recent times for the Financial Times.
First up, he notes that this isn’t entirely a global phenomena, at least not to the extent we see here in the UK. Here he plots the % intending or actually voting for a conservative party against the age of the cohort concerned.
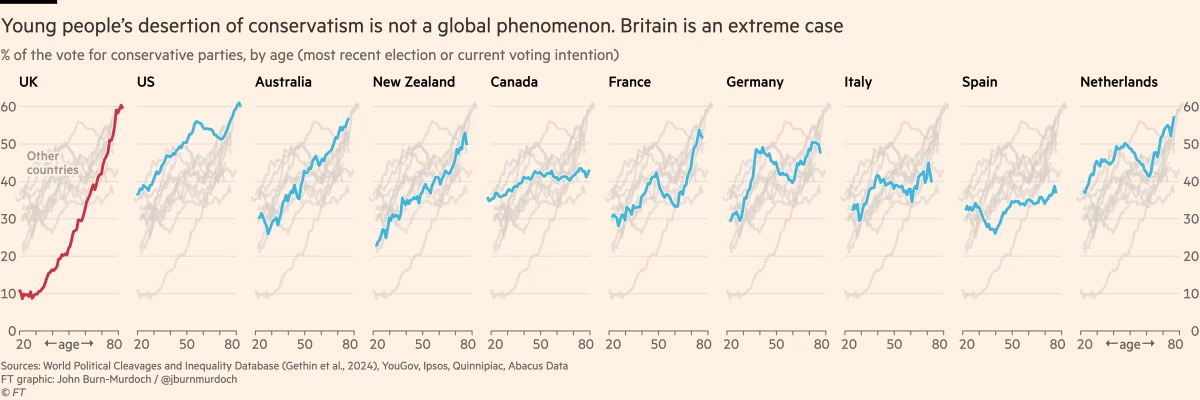
The UK’s current gradient is very obviously the most extreme.
Why? Burn-Murdoch identifies the most important factor as being the “dramatic” decline in upward social mobility seen in the UK.
The conveyor belt of socio-economic progress may have slowed elsewhere in the west, but in Britain it has sheared in two, leaving a generation stranded below.
As one example of an outcome of this there’s been a huge decline in home ownership amongst the young that hasn’t been seen elsewhere.

Young people’s incomes have not increased in relative terms as much as their US counterparts. So at the end of the day, these factors and others have led our younger generation being unable to believe in the classic idea that upward social mobility is possible to achieve, even likely, if you work hard.
Based on data from the World Values Survey, the FT determines that the gap between folk who report believing that “In the long run, hard work usually brings a better life” when segmented by age is particularly high in the UK. Plus the absolute proportion of 18-29 year olds who believe that sentiment to be true in the UK is very low compared to some of our peer countries.

Personally I think they’re right to be extremely sceptical. What is basically “The American Dream” hasn’t been true or felt realistic even in its home country for a long time, and perhaps it never was.
The same FT article also reports that cultural and economic beliefs of the typical young person are now very different from those of the typical Conservative voter according to survey data.
Another place that shift is visible is in the British Social Attitudes survey results. John Curtice writing for The Conversation notes that since 1986 most of the BSA surveys have asked a set of questions that are designed to roll up into a compound score as to where the person concerned falls on the traditional left vs right-wing spectrum of political views. Questions like to what extent the “government should redistribute income from the better-off to those who are less well-off”, that kind of thing. The aggregate of several such questions are scored such that 0 indicates an extremely left-wing person and 100 indicates an extremely right-wing person.
Counter to my intuition, in 1986 the overall score was basically the same for people under 35 years of age in comparison to those who were 55 or older. They only differed by 1 point out of 100 as recently as 2016. Voting preferences certainly changed during this period, but if this score effectively measures what it claims to measure then it appears that any shifts in generational voting weren’t particularly driven by generations shifting their left vs right wing viewpoints away from each other. However, by the end of 2022, the younger peoples’ scores had dropped by an average of 10 points towards the left-wing position, whereas the older cohort’s scores changed by only a single point – meaning that there’s now a notable gap.
Younger people are also increasingly less authoritarian in their outlook. Gen Z are much more liberal than any previous generation according to the National Centre for Social Research. They support for instance the right to protest above necessarily following the letter of the law, the need for civil disobedience in opposition to bad policy, the legalisation of cannabis (despite being less likely to use it than previous generations) and a halt to the inflation of prison sentences.
The NCSR also reports little evidence to suggest that that generations’ views will necessarily change much over time, as they age. Interestingly, a lack of shift on these matters for any cohort based on age is apparently quite normal:
By looking back at the views of older generations when they were younger, we can see whether views change as people age, or whether they stay the same. What we find is that the average views of a generation are very consistent, and don’t change much as people get older.
A previous article by the FT based on data about actual voting behaviour did find what appeared at first to imply a different result, supporting the idea that people do at least vote more conservative as they age, whether or not their political views change. But even in that case the millennial generation appears to be bucking the trend. Contrary to prior generations they’re remaining less likely to vote conservative as they age, both here and in the US.

So now as the years roll by – again particularly since the Brexit referendum – an increasingly higher number of 18-34 year olds report “strongly disliking” the Conservative party. Again, from Burn-Murdoch’s article:

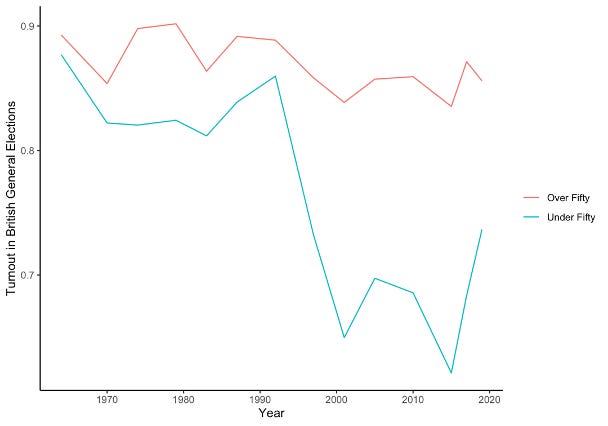
Voting intention aside, one potential issue for those of us who would be perfectly happy to see the Conservatives lose quite dramatically on July 4th is that younger people are much less likely to actually go out and vote in the first place.
This appears to be another fairly recent innovation to a large degree. Ansell shares some figures that demonstrate that from around the 1960s to 1990s people over 50 were more likely to vote compared to the young, but that the difference was fairly small. But then in the 1990s, during the Blair era, the under-50s turnout dropped precipitously, whereas the over fifties kept voting at pretty consistent rates.
Despite this difference resulting in the preferences of younger folk having a disproportionately lower impact in electoral results, this time around the age-based voting intentions differ so dramatically that they are still very likely to have an important effect in our forthcoming election, despite the turnout factor.
Perhaps the most dramatic visualisation of this I’ve seen is the one Ansell provides in his newsletter. It plots, at the constituency level, what the polls currently estimate the predicted percentage of people who will vote Conservative is against the percentage of the constituency concerned that is at least 65 years old.

We do not need any clever statistics to spot the pattern.
