There’s been a claim made over at least the past couple of years by all manner of sources that vast swathes of the working-age UK population have exited the workforce because long-term illness has apparently rendered them incapable of work.
Whilst there have been exceptions, the version of the explanation for this that seems to have attracted most salience within public discourse, especially on the major social networks, is a pretty unsympathetic one. It says something to the effect that firstly, yes this is true and a huge problem for employers, and secondly that the reason comes down at least in part to a sudden deficit in individual responsibility and/or “grit”.
By some of the more rabid – and let me foreshadow by saying incorrect and offensive – tellings, this is largely driven by young folk who are so fragile and snowflakey that being confronted by a controversial idea or routine life-challenge is enough to send them into a spiral of claiming that they are incapacitated with fake-or-otherwise anxiety and other mental health concerns which lazy doctors just sign off as true whenever they are asked to as a tick-box exercise.
And/or that the younger generation is simply inherently lazy and self-entitled. Presumably something magical happened overnight such that Gen Z find themselves unable to do anything but lie around playing Fortnite, and spending their oh-so-generous state benefits on whatever the modern equivalent of the previous “millennials would be rich if they didn’t spend all their money on avocado toast” nonsense is.
In any case, in this telling, not only are these youthful vampires illegitimately sucking money out of the public purse but they’re also responsible for a ton of jobs not being filled. Not surprising nothing productive can get done in the UK if no-one is prepared to work, right?
The dominant political solution demanded to this – quelle surprise – could be summarised as some form of “cracking down” on these fragile layabouts ripping off the welfare system.
Our previous Prime Minister, Rishi Sunak, spoke out about Britain’s “sick note culture”. So his explanation was down to culture, not illness itself: that people default to focussing on what they cannot do, and our doctors are happy to give them an excuse to avoid even trying. To combat this, his government had plans to “overhaul the benefits system” which has illegitimately “opened the floodgates for millions of people to be written off work and into welfare”.
The current Labour government didn’t at first seem to have all that much of a radically different opinion. The BBC reported PM Starmer’s assertion that “people claiming long-term sickness benefits should be expected to look for work.”
A brief diversion – media bias in the UK
To wander off the topic at hand for a moment; given that the above is a kind of view most associated with right-wing political discourse, the dominance of this explanation within the public domain may be of little surprise given that, per PressGazette, there are three times as many newspapers in the UK that lean right than those that lean left. In January of last year they were estimated to have a circulation over seven times larger.
| Publication | Jan 2024 circulation | Political leaning |
|---|---|---|
| Metro (free) | 953,233 | Neutral |
| Daily Mail | 705,311 | Right |
| The Sun | 700,000 | Right |
| Daily Mirror | 240,799 | Left |
| Evening Standard (free) | 234,492 | Right |
| The Times | 180,000 | Right |
| Daily Telegraph | 190,000 | Right |
| Daily Express | 147,267 | Right |
| Daily Star | 131,640 | Neutral |
| i | 126,001 | Neutral |
| FT | 108,125 | Neutral |
| City AM (free) | 68,009 | Neutral |
| The Guardian | 60,000 | Left |
This effect may of course be tempered by the dwindling popularity of newspapers as folk’s primary consumption of news – although the same study showed a right-ways slant for news websites, TV and radio broadcasting. Elsewhere we have seen a similar right-wing bias in the content (and fake news) that social media elevates.
Back to the subject at hand. Are tons of British workers really suddenly finding themselves too ill to work? Do we know why? It’s time to dig into the data to see what we can find in support or or against such a hypothesis.
A couple of notes to start:
- Much of this data will be based on work that originates from the Labour Force Survey. This is the biggest regular household survey done in the UK, as well as being the source behind the official proclamations regarding (un)employment rates.
- It is likely also to be a couple of years out of date. Much of this is down to how long it has taken me from making notes on the subject through to actually writing this post. But also a lot of the research I’ve seen on this comes from a couple of years ago, with the focus often being on the results of the Covid pandemic. Not that Covid has gone away – thousands of people are still dying from it. But its official status as an emergency and hence people’s focus on it is largely over; at least for the lucky majority not personally suffering from its potentially horrific after-effects.
Contents:
- Summary
- Are more people actually off work due to long-term sickness?
- Did Covid-19 cause this?
- Is the increase in long term sickness driven by young people?
- Is the increase in long term sickness mostly driven by mental health issues?
- What about overall economic activity rates?
- Could the increases in inactivity due to long term health conditions be related to problems with the UK’s health provision?
Summary
There has been a significant increase in the number of working-age people in the UK classified as economically inactive due to long-term sickness, with about half a million more people in this category in 2022 compared to 2019.
Some of this is likely Covid related – but
- the trend started before the pandemic took off and
- other countries have generally seen their overall economic inactivity rates return to pre-pandemic trends in a way that the UK has not.
Whilst younger age groups did see the largest relative increases in economic inactivity due to long-term sickness rates, the main contributors to both a) the total number of people economically inactive for long term health conditions and b) the increase in that number are people aged 50-64.
Mental health conditions are commonly reported in this long-term sick population. However, they are usually listed as secondary conditions rather than being the sole or primary factor keeping someone unable to engage in economic activity. In terms of primary health causes, larger increases have been seen in categories such as back and neck pain. There’s also been an increase in people reporting having multiple simultaneous health conditions.
Most working-age people who became economically inactive due to long-term sickness in this period were not actually employed beforehand. They were already economically inactive for other reasons. Likewise most people who stop being classified as long-term sickness do not move back into employment. This might suggest that long-term sickness isn’t causing a mass exodus from employment, but rather that health is becoming an increasing problem for people who are not in employment. More people are becoming economically inactive because they’re taking early retirement than because they’re entering long term sick status.
This has implications for policy. The “take health benefits away from people so they are compelled to magically regain their health enough to work rather than starve” idea, even on its own inhumane and illogical terms, could only possibly work if it was solely their health that was preventing the person concerned from working. It is not at all intuitive that a shift ever further towards such a policy – or indeed a cure to their illness – would make a early retiree who has now become ill decide to go back to work after they recover.
One suggestion that’d been mooted for why the UK is alone in these dynamics is the fallibility of our healthcare system, largely due to years of underfunding and other damaging political decisions. It is quite possibly a coincidence, but the number of people who have been waiting more than 12 months for hospital treatment is roughly the same as the number of people who aren’t working for reasons of long-term sickness. There are also some factors around financial security and pension flexibility that may play a separate explanatory part.
Now onto the detail:
Are more people actually off work due to long-term sickness?
First up: is the claim that vast amounts of the working-age UK population have recently been declared as economically inactive due to long-term health concerns true? So many politics-adjacent claims people have very strong feelings about are in fact not supported by anything that could remotely be described as methodologically sound data, so it’s always worth checking.
Starting off with a 2022 report from the Office of National Statistics, here’s a chart showing how the number of working-aged people “economically inactive” due to long term sickness has changed since 2017.
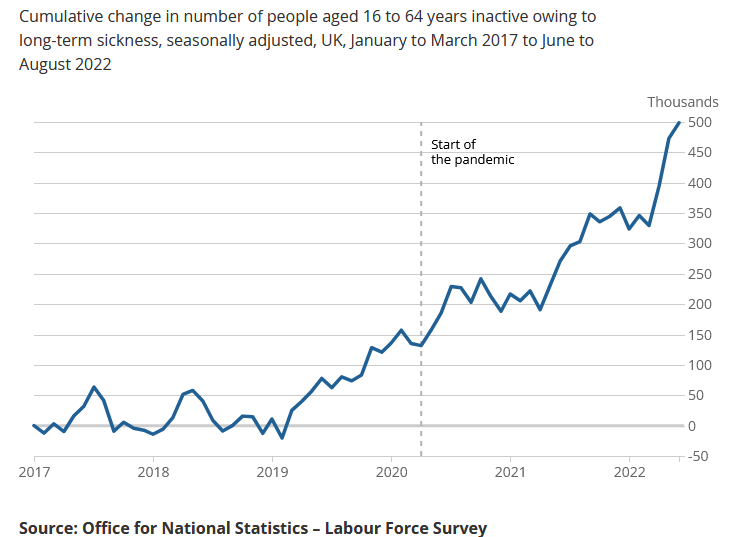
Economically inactive basically means “aren’t actively looking for work”. This doesn’t include unemployed folks who are busy trying to get jobs. Officially it is defined as:
People not in employment who have not been seeking work within the last 4 weeks and/or are unable to start work within the next 2 weeks.
Thus about half a million more 16-64 year olds were economically inactive – neither at work nor seeking work due to long-term sickness – in 2022 compared to 2019.
If I, using data from the same report, was also to tell you that:
- Mental health and nervous disorders as a primary cause of economic inactivity has gone up between 2019 and 2022 by 22%;
- The largest relative increases in long-term sickness in this period were in younger age-groups.
- As were the largest relative increases specifically in the above mental health category.
You might think “case closed”- the claims, if perhaps not the sneering judgement about it, seem to be backed up by these numbers.
Of course though, there being still many paragraphs left to read below, this is not the whole truth. It may not really be much of it. The situation is at least far more nuanced, and, even taking the above data into account, perhaps in some ways the opposite of what it seems at first glance.
Before getting into that, let’s check one intuitive explanation.
Did Covid-19 cause this?
Intuitively, maybe we’d think, hey, much of this is obviously going to be the case given that the devastating Covid-19 pandemic swept the world during this time. In fact that was the focus of a lot of the reports I’m basing this on.
Covid killed millions of people and caused damage, short and/or long term, to many more. Is it really surprising that there’s so much extra serious illness about? You might even try to explain the “increased in youth” phenomena by some argument around how Covid-19 was more deadly for older people, and a consequence of any tragic fatality is that you fall out of the economically inactive statistics.
What might we expect to see if Covid was the driver of this phenomenon? Likely:
- The rates of economic inactivity due to long-term health conditions would start rising only after the Covid pandemic became widespread.
- Covid was a world-wide thing. So even if the UK under Boris Johnson may have handled it relatively badly, a reasonably similar direction of effect would be seen in most other countries.
Point 1 doesn’t seem to be true if we look at the ONS chart above. The rise clearly starts in early 2019. In fact the largest year-on-year increase is that seen between 2019 and 2020. The pandemic didn’t hit hard until later in 2020.
And point 2 isn’t true, at least in the medium-to-long term. Here’s figure 4 from a great summary of the issue as reported in the “Where have all the workers gone?” report courtesy of the Economic Affairs Committee.
Entitled “Comparison of economic inactivity rates among developed economies”, the x axis is year and y axis is % of people aged 15-64 that are neither employed or seeking work.

That chart was quite shocking to me when I first saw it.
Unsurprisingly during the midst of the worst of the pre-vaccination pandemic, 2020-2021, a lot of people in every country were unable to work or seek work.
But in the vast majority of countries, even by 2022, the preexisting trend of economic inactivity rates had returned to the pre-pandemic rates, or closer to them. But not here in the UK where by the looks of it the rate was continuing to increase, to further diverge from its previous trends, as we reached 2022.
A couple of quotes on the conclusions from the above that the Economic Affairs Committee report featured:
…while increases in inactivity during the pandemic were common across economies, the UK stands out among developed economies in not having seen a return of economic activity rates to their pre-pandemic trend. Similar economies (such as USA, Australia and Canada) have seen their inactivity rates fall after the pandemic.
…
…since the pandemic if the UK had matched the economic activity rate growth of Australia, France or Netherlands, there would be an additional one million people in the UK workforce.
OK then, so:
- The increases in economic inactivity in the UK started before the Covid-19 pandemic really did, and,
- Almost every other country from the above report had returned to its previous economic inactivity trend by 2022.
Occam’s Razor would suggest then that the biological reality of the pandemic likely cannot be a complete explanation for what we see here.
One further piece of context, of interest even if perhaps not directly relevant to the topic at hand here, provided by the Economic Affairs Committee: despite the scary looking chart. The rate of economic inactivity in the UK remained lower that the OECD average. You can see that if you look hard at the y axis of facets of the chart which differ per country. That’s not to say we shouldn’t be worried by any within-country dramatic increase. We should! But this report does not suggest that we had at that point ended up with a particularly high rate of economic inactivity compared to other nations.
After reading some of the headlines you might also be surprised by the relatively small % changes involved. Now, countries have a lot of people in them, so small percentages can mean big absolute number changes. We shouldn’t lose track of the correct idea that every single one of these lives is important; every person deserves to live a good and fulfilling life – not that I’m convinced that being “economically active” is necessarily the sole route to doing so. But if you got the idea from the media frenzy that the UK must have gone from for example 10% economically inactive to 90%, well, the change at the perhaps the highest point of the drama seemed to represent probably under 1 percentage point of the total potential workforce.
Is the increase in long term sickness driven by young people?
Should we blame – or, far better – feel sympathy and perhaps even some responsibility for the plight of the younger potential workers amongst us? Is their illness driving the net increase in these cases?
We saw above that cohorts of younger-age people saw the largest relative increases in inactivity due to long-term sickness rates. But note the word “relative” in that sentence.
Typically older people have more medical concerns that can lead to this inactivity classification. Nothing has changed about that. Whilst we can and should be worried above rapidly increasing rates of health problems for our younger citizens, this doesn’t mean either that most of the folk signed off work are young, nor even that the big increase in economically-inactive-for-this-reason numbers is mostly made up of them.
In fact, quite the contrary. Per the afore-mentioned ONS report, more than half – 55% – of the people out of the workforce due to long-term sickness in the second quarter of 2022 were aged 50-64 years old.
They have a dominant role in the increase in economic inactivity rates between the pre-pandemic and more contemporary period too:
Adults aged over 50 years have been the main contributors to increases in economic inactivity for all reasons seen in recent years.
Another ONS report – “Reasons for workers aged over 50 years leaving employment since the start of the coronavirus pandemic” – tells us that:
In May to July 2022 there were 386,096 more economically inactive adults aged 50 to 64 years than in the pre-coronavirus (COVID-19) pandemic period (December 2019 to February 2020).
Something like this is also visible in figure 6 of the Economic Affairs Committee report which measures the “Cumulative change in number of people aged 16-64 who are economically inactive by age group since December-February 2020”.

There is unquestionably a dramatic increase in younger people economic inactivity – but in terms of absolute numbers, more of the increase is from the 50-64 year olds.
Is the increase in long term sickness mostly driven by mental health issues?
To be honest, the answer to this question is immaterial to me for the most part. Mental health conditions are as real as, and can be as debilitating as, physical health conditions. We should have equivalent sympathy to the sufferers of both. However the answer to this would be of relevance to the interventions necessary to provide those with medical conditions that render them unable to work with some relief.
To answer this I found the a report from the Office of National Statistics called “Rising ill-health and economic inactivity because of long-term sickness, UK: 2019 to 2023” particularly useful.
They report that in 2023 the most prevalent health condition reported by those who were economically inactive because of long-term sickness was the 53% who reported having “depression, bad nerves, or anxiety”; all of which could be classified as mental health issues. That’s in addition to the separate category of “mental illness” which would add to the total of the category.
In addition the rise over time in these conditions was substantial, with the number of people inactive based on those conditions rising by 40%.
This chart from the same report illustrates the prevalence and increase quite nicely.

However, this doesn’t tell the whole story.
People can have more than one relevant medical condition. In fact many do.
The ONS report reveals that for those inactive due to long term sickness there’s been a 42% increase in the number of people reporting a (fairly terrifying to me) 5 or more health conditions – now totaling not far off 1 million adults in 2023. That’s around 38% of all inactive due to long term sickness.

This shift happens to varying extents in all age groups, leading the ONS report authors to conclude that:
This suggests that those who are inactive because of long-term sickness have increasingly complex health issues, the majority with more than one health barrier to them returning to the labour market
An article from the Financial Times has another fairly startling visualisation. This chart plots the cumulative change in the number of people aged 16-64 who are outside of the labour force by number of long-term health conditions:

In fact most of that 40% increase in the number of people reporting depression, bad nerves or anxiety shown in the ONS report comes from folk reporting it as a secondary health condition contributing to their economic inactivity rather than the primary driver. It increased 50% in terms of secondary health condition reports between 2019 and 2023 vs a smaller 14% increase in it being described as the primary health condition.
In terms of the absolute count, the same report finds that whilst 1.35 million long-term sick report having depression, bad nerves or anxiety, that most of them – over 1 million – report it as a secondary condition.
Figure 5 in that report shows a breakdown of additional conditions that people reporting some of the most prevalent primary conditions also suffer from. In each case roughly half are reporting a(nother) mental health condition.

What then is the most prevalent primary condition? A different ONS report – “Half a million more people are out of the labour force because of long-term sickness” – shows the absolute count and increases by some of the primary conditions reported between 2019 and 2022.
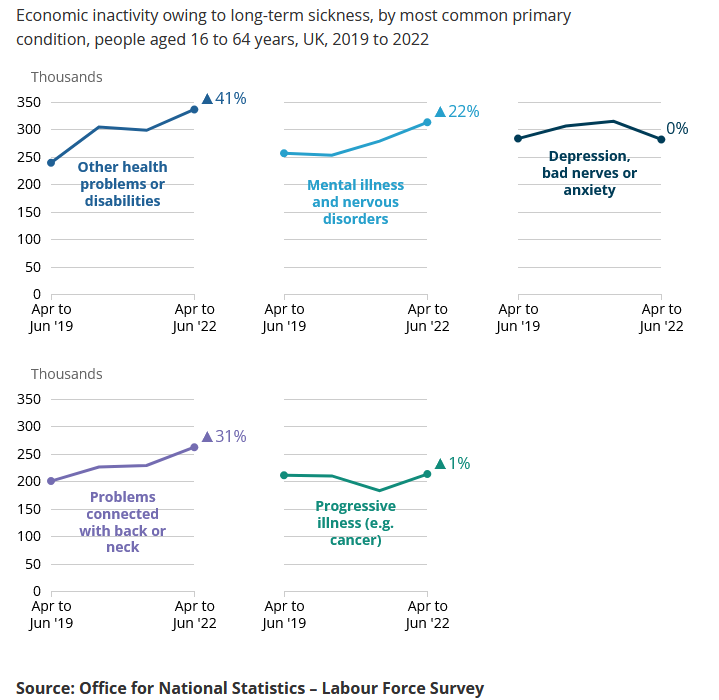
In fact the aforementioned depression, bad nerves or anxiety condition hadn’t really risen at all over that period in terms of primary condition. Other types of mental health had, but by a lower relative % than back and neck problems or “other”. The not all that useful “Other” category saw both the biggest increase and the highest absolute numbers.
All in all, summing together than 2022 figures would suggest that less than half, around 42%, of primary conditions were in the mental health, nervous disorders, depression, bad nerves or anxiety categories. The percentage has actually fallen a few percentage points since 2019.
Interestingly the report speculates that the rise in back and neck problems might relate to the rise in home-working since the pandemic. Presumably people often do not have the sort of ergonomic chairs and workstations that offices are supposed to provide at home. Certainly many of the folk I know who made that kind of transition did not end up with new home office equipment.
They also suggest that it’s possible – but unknown – that many Long Covid sufferers may have ticked the “other” option – but that that Covid is unlikely to be the main contributor to the rise seen because the biggest jump happened between 2019 and 2020, which were only the early stages of the pandemic.
Once again, the FT has a useful chart plotting the cumulative change in the number of people aged 16-64 outside of the labour force vs pre-pandemic trend, this time by main long-term health condition – in addition to weaving in some of the non-health-related reasons folk might have for exiting the labour force. We’ll come back to the latter point later on in this post.
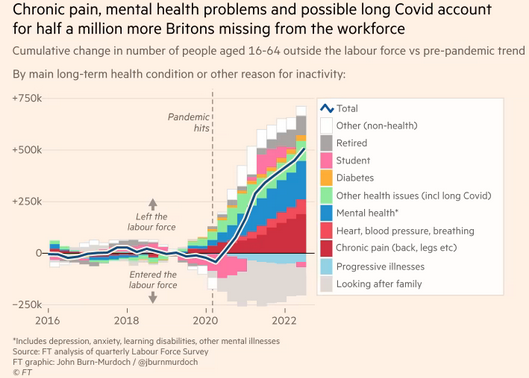
Mental health related conditions are a big part of it, but not most of it, and far from the only category to show increases.
This conclusion is likely also supported by looking at the increase in a specific type of UK welfare entitlement aimed at supporting people with long-term health conditions – the Personal Independence Payment, or PIP. The total number of these claims rose from 37,000 per month in 2019 to 64,000 a month in April-July 2022 according to a publication from Parliament’s Economic Affairs Committee.
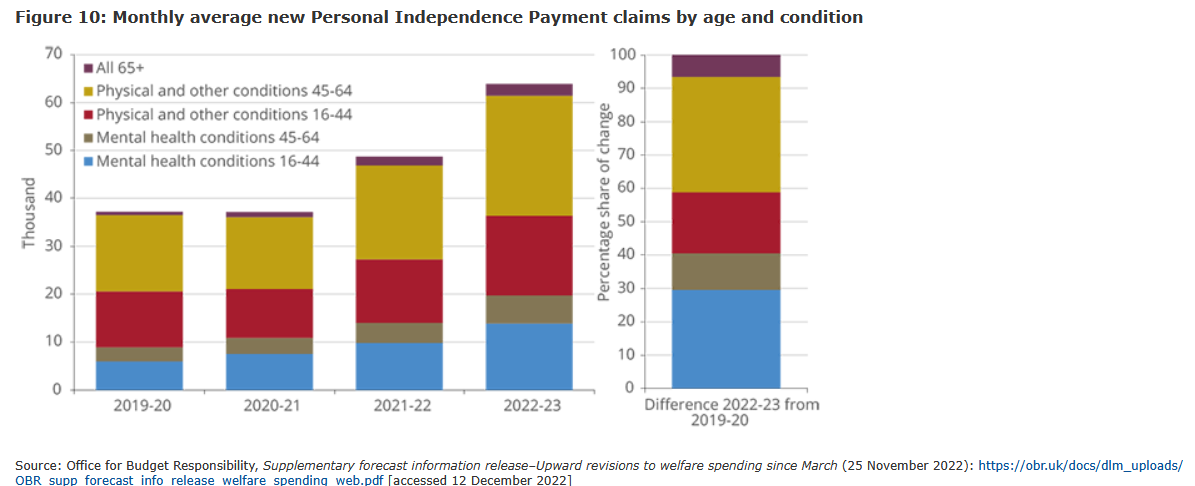
There has been a substantial increase in claims relating to mental health – and indeed mental health in young people. This is of course extremely upsetting for the people concerned and we should do everything we can to alleviate their suffering, and ensure they can live a full and good life no matter how successful we are with the former. But the “young people with mental health conditions” (or even “everyone with mental health conditions”) segment doesn’t dominate the numbers. In fact, the report notes that:
…the largest rise in claims has been among older age groups with increases in claims for physical and other conditions in the 45–64 year old group accounting for 35% of the increase in average monthly new claims between 2019/20 and the first four months of 2022/23.
What about overall economic activity rates?
People who are “economically inactive” due to long-term sickness are of course only a subset of people who are economically inactive overall. Other possible reasons include being a student, being retired (whilst still of “working age”), being a home-maker, being wealthy enough to not desire a job, and so on.
Based on the first chart I shared in this article, which showed a dramatic looking increase in the number of folk in the long-term sickness category, you might intuit that the general category of economically inactive must have gone up by at least the same amount.
That would imply that if last month 100 people became economically inactive due to long-term sickness that’s 100 jobs that were being previously done by someone that now need filling; suggesting, assuming an era of reasonably low unemployment, that businesses might have something of an employee-shortage crisis to contend with.
Is this the dynamic at play?
Figure 1 of the “Rising ill-health and economic inactivity because of long-term sickness” report might lead one to conclude otherwise – at least in the more recent months analysed.

See how the light blue line – economic inactivity due to long-term sickness – continues to go up, even whilst the general economic inactivity count (dark blue bars) decreases in the last few months of that chart. For what it’s worth, it was also a lot less steep than the general increase in economic inactivity earlier months of that chart.
How can this be? There’s really only one explanation. Some chunk of people who are becoming economically inactive due to long-term sickness were not economically active in the first place.
This turns out to indeed be the case, as highlighted by the Half a million more people are out of the labour force report.
They analyse the time between quarter 1 2021 and quarter 2 2022 and find on average that only 19% of people that go into the “economically inactive for long term sickness reeason” were actually employed immediately beforehand.

Nearly 70% were already classified as economically inactive. These are then not immediate net losses to the workforce. They weren’t doing a job before they became classified as long-term sick.
What were they doing?

The largest category were looking after their family or home rather that participating in paid work. A good chunk had retired. Just over one in five were not working due to temporary illness.
The same turns out to be true in the other direction. What happens to folk once they cease being classified as long-term sick? Do they go back to their jobs / find a new job?
Not all that often:

So almost 2 out of 3 people who cease being inactive due to long term sick remain inactive for some other reason.
A 2022 report from the Institute for Fiscal Studies backs this line of thinking up, noting that:
…the rise in the number of people who are inactive due to ill-health does not necessarily imply that all these people have left the labour force as a result of ill-health.
Another possible explanation would be that:
More people may be leaving the labour force for other reasons – for example, because they are taking early retirement – and, simultaneously, those already out of the labour force may be getting sicker.
Their report focuses on those aged 50-64 on the basis that that group was the one that appears to have most contributed to the increased rate of activity since the pandemic started.
First up, they look at the proportion of 50-64 year olds that are inactive due to long-term sickness over time by whether or not they had been in paid work within the last 5 years. 5 years is a pretty long period of time!
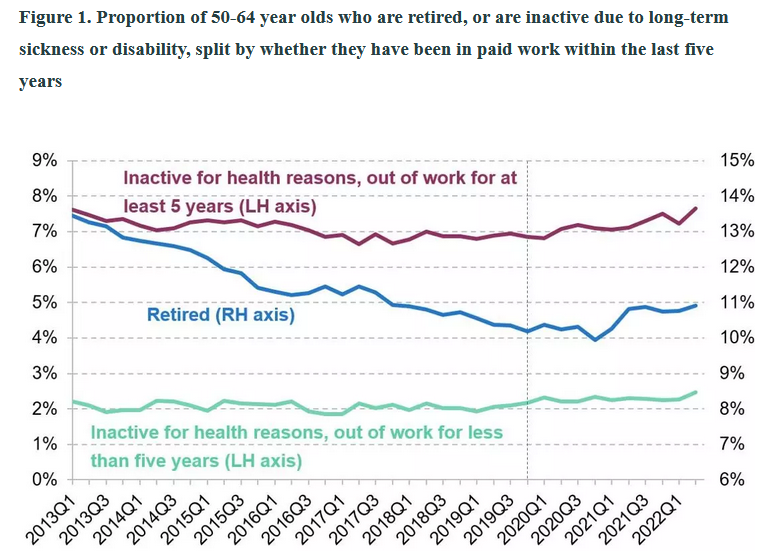
Firstly, this chart shows quite neatly that, whilst there has been a rise, it is far less dramatic in absolute percentage-point terms than one might have thought from the headlines at the time. But the UK has a lot of people in it, so even small percent rises can imply difficult for plenty of people. We should not seek to minimise the importance of it in terms of assisting those who need help.
Nonetheless, most of the 1.1 percent point increase in economic inactivity rate due to long-term sickness/disability from the start of the pandemic to the last point on this chart is coming from people who weren’t in employment for the previous 5 years.
Of the 1.1 percentage point increase in the fraction of 50-64 year olds who are inactive for health related reasons, 0.8ppt (73%) of that rise has been amongst people who have not worked in at least five years. The figure also shows that an additional 0.7% of the 50-64 year old population is economically inactive due to being retired compared to the end of 2019.
Likewise the % of people with that long-term sick economic inactivity status is a lot higher in proportional terms too for those not working in the last 5 years. So logically:
If the rise in health-related inactivity is predominantly amongst those who have not recently left the labour force, then worsening health cannot be the key explanation for the increase in movements out of the labour force and into economic inactivity during the pandemic.
What does this imply?
…movements directly out of employment and into inactivity have been to a greater extent into other forms of inactivity, such as retirement. At the same time, it implies that there have been increasing levels of ill-health amongst those who have been out of work for an extended period of time.
The latter is a real problem we need to solve for sure. But it’s different problem to “most of the UK workforce is suddenly claiming to be ill”.
So where are folk going when they leave employment?

Well, most commonly to retirement. In fact transitions from employment to health related inactivity didn’t even increase all that much during the first couple of years of the pandemic. It was more the retirement and misc “other” category that went up.
Something similar is visible in another report written at the end of 2022 by the IFS, one that this time looks at PIP claimants. They conclude:
We find no evidence of any change here: in mid-2022, about two-thirds of claimants had been out of work for at least five years, with the remainder evenly split between those out of work for less than five years and those in work – a composition that has remained very steady before, during, and since the pandemic.
This is consistent with the recent rise in health-related inactivity, which research shows is also driven primarily by people already out-of-work becoming unwell, rather than those in work leaving the labour market because of deteriorating health.
In other words, ill health does not appear, yet, to be a dominant factor causing exit from the labour force.
Nonetheless, irrespective of whether it’s depleting the workforce, more and more people are reporting ill-health – which is a troubling issue in its own right.
But worsening health in the UK does appear to be a real and worrying phenomenon, creating multiple challenges, including this further pressure on the benefits system
Of course these categories aren’t all as neatly bucketed and independent as they might seem on a chart. It is possible that some newly retired people did retire partly due to their health. In that case some might categorise themself into the retired category, others in the health category.
Nonetheless, if we take these results at roughly face value then it has a lot of implications for what the government’s policy response should be.
Neither the dark, unethical and useless idea of something like :
“We should punish sick welfare claimants so hard that this somehow magically forces them back to work.
or the rather more humane and sane idea that:
“We should help people get back to full health and then they will go back to work.”
is going to achieve the outcome of “lots of people go back to work” when it wasn’t (only) their health that was keeping them out of work in the first place. Are retired people suddenly going to decide to un-retire because their health improves? That is far from a foregone or even intuitive conclusion.
Per the Economic Affairs Committee report:
Much of the rise in sickness-related inactivity is among people who were already inactive, rather than people who were employed then becoming inactive due to sickness. This points against expecting future improvements in health to feed quickly through into a reversal of recent increases in inactivity.
They further were told by various correspondents that:
…there are three main factors causing the increase in economic inactivity among older workers: long-term sickness, earlier retirement and the UK’s ageing population. The final point has been affecting the labour force since at least 2008 but is no longer masked by other factors which were causing a net increase in activity…
They also present an interesting looking chart which seems to show that much of the increase in economic inactivity rate is amongst people that in any case don’t want a job. This contrasts with the effect on inactivity rates when looking at the impact of the previous global financial crisis, where an increasing proportion of the inactive did report wanting a job.

Sadly the link that they supply to reference that chart won’t work for me so I can’t dig into exactly what it’s showing. But at a glance: more people who don’t want jobs not having them seems prima facie good if the reasons for them not wanting jobs are of positive salience such as “I’m happily retired despite being of working age”. Of course the chart above does not provide evidence in either direction for that positive outcome.
They summarise:
…during the years following the Global Financial Crisis, the inactivity rate fell, especially among people who did not want to work, whereas following the pandemic the inactivity rate has increased among people who do not want a job.
The Committee further notes that the IFS report shows that:
…among those aged 50–64 years old (the age group which accounts for the largest rise in inactivity since the pandemic), flows from employment to retirement have increased more than flows from employment to sickness
and spends sometime looking into potential reasons for an increase in early retirement. They note that evidence on this topic is a little patchy, but:
The limited information available on the wealth of new retirees reinforces the impression that, on average, they are a reasonably resourced group.
Most in the 50-64 age group own their own homes, usually with no mortgage. A large number of them claim to be funding their retirement via private pensions, savings, or investments (i.e. not relying entirely on the state). Most do not expect or wish to take paid work again, and generally they retired straight after leaving their job; not in desperation after a period of trying and failing to find a new job.
That isn’t necessarily anything new. So what caused the more recent uptick in folk actually making the leap to retirement before reaching 65? The Committee report two main hypotheses:
- Experiments with a different lifestyle during the pandemic meant that people learnt more about their preferences for retirement versus work, and some of those people realised that an accelerated retirement was more appealing than they had thought. It is possible that the furlough scheme, which kept people attached to their jobs, accentuated this effect by giving people no immediate imperative to search for another job, meaning they could experiment with retirement as a lifestyle.
- Accelerated retirement may have been facilitated financially by a combination of the UK’s relatively flexible pension access arrangements and the extra saving that some households built up during the pandemic.
So, to be a bit facetious about it, perhaps the change in lifestyle that the pandemic caused was such that people realised that their jobs sucked – so anyone wealthy enough to not need to return to normal post-pandemic work life decided not to.
Some folk certainly did find themself a bit richer:
The Bank of England estimated that households built up more than an extra £125 billion in savings from March 2020 to November 2020; this increased to over £200 billion by June 2021.85 This could have enabled some people to accelerate retirement plans.
If that is the case, then, once again, no amount of slashing health or unemployment benefits is likely to get these people back into work.
Although detail on the wealth of retirees is limited, the majority of those who have left the labour force to retire do not wish to return to work. It is not clear that measures taken by employers, or the Government would encourage them to return to work, given their stated attitudes.
Interestingly, although there doesn’t seem to be all that much evidence on this so far, it has been conjectured that this is some of the reason that economic inactivity rates in the UK stayed at their high level whereas, as we saw, many other countries have reverted to their pre-pandemic trend.
Two reasons: firstly, private pensions and savings play a larger role and are more flexible in the UK than elsewhere . This makes it easier for people who are well-resourced to choose to retire early.
Werner Eichhorst, Coordinator of Labor Market and Social Policy in Europe, IZA Institute of Labor Economics, told us that private pensions and savings play a much smaller role in continental Europe than in the UK. As a result, there is no trend towards early retirement in European labour markets. Similarly, Ronan O’Connor, Director, Strategy and Governance Directorate at the Department for Work and Pensions, said that UK pensions freedoms have been popular and given people more choice about retirement than in other developed economies.
Secondly, UK workers feel rather less happy about their jobs than employees in other countries do. This presumably makes it more likely that if they feel they could retire then they will choose to do so at the earliest possibility.
A survey by Phoenix Insights, a think tank focused on work and finance for people living longer lives, found that UK workers aged 50-64 have a less favourable view of work than in the USA and Germany (58% of workers in the UK liked their job, compared to 74% in the USA and 73% in Germany).
UK workers were also more likely to have changed their views of working during Covid:
…workers in the UK were more likely to rethink how they view working due to the COVID-19 pandemic (40% in the UK compared to 28% in the US and 30% in Germany).
Could the increases in inactivity due to long term health conditions be related to problems with the UK’s health provision?
So, returning to one of the original themes of this article, what are the theories around why this increase in the economically inactive working age population rates not returning to their pre-pandemic trend is a very British phenomenon, despite the Covid-19 pandemic wreaking havoc pretty much everywhere?
After all, even if sickness isn’t causing most of the exit from the workforce, it would be inhumane of us to not want to find out why people seem to be developing long-term health conditions at surprisingly high rates.
A 2022 article in the FT find the “most plausible” explanation to be related to problems with healthcare in the UK.
…we may be witnessing the collapse of the NHS, as hundreds of thousands of patients, unable to access timely care, see their condition worsen to the point of being unable to work.
And it could well of course be a coincidence, but they also noted that:
The 332,000 people who have been waiting more than a year for hospital treatment in Britain is a close numerical match for the 309,000 now missing from the labour force due to long-term sickness.
At the time, over a quarter of Britons reported not even trying to make a primary care appointment that year because it was too difficult to do so. In the UK that’s usually the first step towards any kind of diagnosis and treatment.
Whilst I personally am a tremendous fan of the NHS and have had generally good experiences, the FT is concerned that:
…where other countries’ healthcare systems are proving resilient, the UK’s is on its knees.
Why? It’s nothing to do with its basic existence or the in-my-view pretty exemplary funding model – something which remains a source of great support and pride from the British public no matter how frustrated they feel about its present performance. Instead, a 2022 BMJ editorial identified some concerns and reasons around the execution, mainly related to what might be summed up as politics getting in the way of efficacy:
Today may be the most difficult day the NHS has ever experienced. The headlines will focus on the pressures created by the heatwave and that most visible sign of healthcare failure—ambulances queuing outside hospitals.
But, as readers of The BMJ and HSJ know all too well, this brutal situation is the culmination of many factors, which include but are not limited to prolonged periods of underfunding in the past decade, lack of an adequate workforce plan, and a cowardly and shortsighted failure to undertake social care reform.
Underfunding is an accusation levelled from several other sources too – particularly during the recent long-lasting period of Conservative party governance that the UK had from 2010 through to 2024.
On the surface, they often claimed to have “protected” NHS spending, and yes, to their credit, they did not literally reduce it. However, a key problem is that the cost of providing healthcare is not an unchanging flat figure. It naturally tends to increase due to, amongst other things an “ageing population, the rising cost of drugs and technology and the growth of chronic conditions“.
Another BMJ article spells out the effects of the underfunding. Please excuse the long extract, but I think it’s useful.
Political choices by the Conservatives in government weakened the NHS and made it harder for staff to deliver a high performing service. A decade of underinvestment going into covid-19 constrained what the NHS could do.
Health spending grew by around 2% a year in real terms between 2010 and 2019—well below the long term average in England (3.8% a year since the 1980s). Low capital investment left staff working in crumbling buildings, with inadequate equipment and IT.
It also left the NHS falling behind other health systems. If the UK had matched comparable European countries’ average capital investment in healthcare as a share of gross domestic product (GDP) between 2010 and 2019, the UK would have invested £33bn more (around 55% higher).
Failures in workforce planning meant the NHS went into the pandemic with fewer doctors and nurses per person than most comparable countries. Staff also had to cope with fewer physical resources, such as hospital beds and scanners.
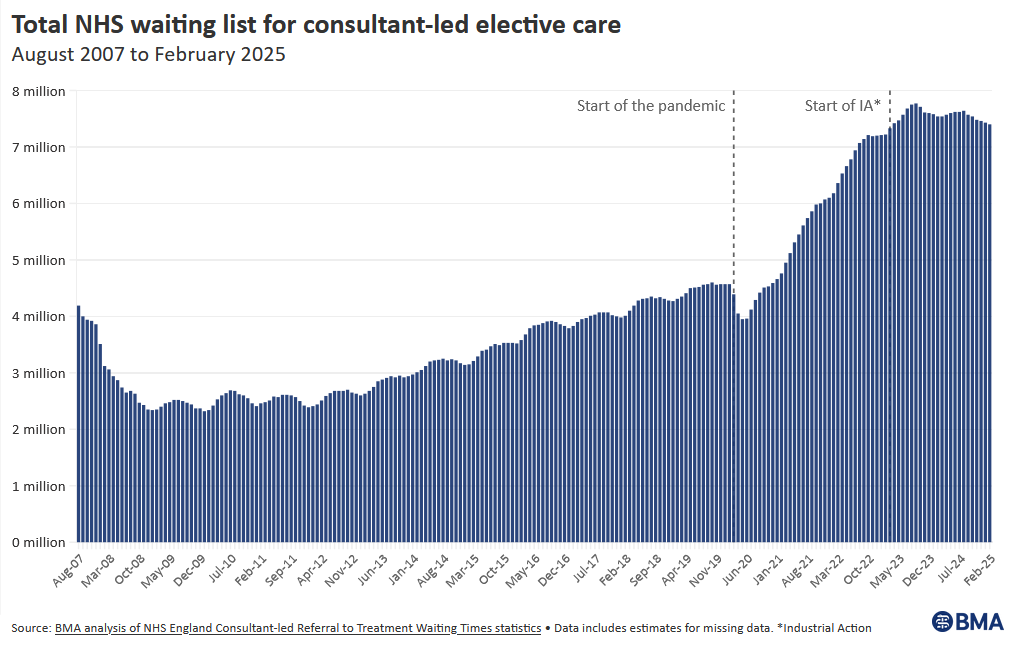
The British Medical Association’s chart on waiting lists bears some of this out. NHS waiting lists seems to have been slowly increasing ever since the early years of the Conservative government, and of course dramatically exacerbated by Covid.
A 2022 article from the Financial Times was even more galling, suggesting that “Britons now have the worst access to healthcare in Europe”.
This can be seen in terms of the percentage of adults that claim that their healthcare needs weren’t met in the prior year. Much of that was driven by waiting lists. These increases all started pre-pandemic.

They conclude that:
Over the past year, one in six UK adults has had a pressing need for medical examination or treatment and been unable to get access, with almost half of these cases due to the length of waiting lists, according to data from YouGov and Eurostat. This is the highest figure out of 36 European countries and almost triple the EU average.
Likewise, David Finch from the Health Foundation told the Economic Affairs Committee that :
There was underlying and pre-existing poor health within the population before the pandemic, but backlogs and waiting lists in the NHS are exacerbating the situation. That is extending the period in which people already in poor health are in poor health … leading to a risk that, if people who become sick are not treated fast enough, they could lose employment and then become inactive.
During the last administration the Conservatives also cut social care reform funding, which has driven a number of people who could have done just fine were they to have had access to adequate social care into the last-resort arms of the NHS.
The new Labour government, to its credit, claims to be seeking to improve the standard of and standard of and access to healthcare. So far it sounds like already we might be seeing some improvements in provision, albeit that it’s far too early to judge.
On the other hand, the Labour administration also plans to decrease a lot of the welfare support aimed at supporting those with life-changing health conditions and disabilities, which clearly stands a high risk of making life worse for a tremendous amount of the least advantaged people in society. Unless of course their simultaneous plan to introduced tailored support to help some of these people into suitable employment actually pans out well enough and quickly enough to compensate for it. I’d far rather prefer to wait and see if there’s any evidence that the latter is going going to work in a humane and effective way before taking such potentially damaging action on the welfare side. They also seem keen to continue at least some of the horrendous decline in social care provision inherited from the previous administration.
Where this will net out remains to be seen. One can only hope that the pressure on the new(ish) government to change their mind on at least the welfare cuts is successful, that they swiftly develop an interest in social care, and that their healthcare initiatives pan out at least as favourably as they claim they will.
After all, to borrow the words of a former US vice president, Hubert Humphrey:
The moral test of government is how it treats those who are in the dawn of life, the children; those who are in the twilight of life, the aged; and those in the shadows of life, the sick, the needy and the handicapped.
