Fairly often it seems dashboards are requested that aggregate the past x days worth of data into one overall figure. In the latest case this was to sum the last 7 days worth of sales in the data. It seems to me that often this is not really the optimum way to display such data when all sorts of lovely graphical trend and comparative charts are available, but I guess there are indeed a few use-cases.
But consolidating the latest 7 days worth of data into 1 figure seems to be more complicated than one might think in Tableau. Thanks to inspiration from Caitlin in the excellent Tableau forums, below is a way that worked for me.
My first thought was date filters. Tableau has built in relative date filters, to show dynamically data within the last 7 days from today which is a great and easy way if you know that your data is always up to date to today. In my use case, that was not the case. Data might be old, so I needed the sum of last 7 days sales where the last date considered is the most recent transaction date of the data – no matter when that transaction date was.
It would be nice if one of the options in “anchor relative to” part of the relative date filter box was “last date of data available” but so far that’s not the case that I can see.
My second thought was a moving sum table calculation, another handy built in Tableau function, which you could ask to sum each day the previous 7 records. This didn’t quite work though as I had some dates where there were no transactions. In that case, Tableau would sum the last 7 records, meaning that if 1 day had no transactions you would actually be getting the last 8 days worth of records. I had hoped there might be some built in calendar cleverness here as some of the other Tableau table calcs seem to understand the concept of day, month, year – but this one seems to just be summing the last 7 records, irrespective of the semantics of the date.
To show precisely what I mean, here’s some source data:
| Date | Sales |
| 01/01/2014 | 5 |
| 02/01/2014 | 4 |
| 04/01/2014 | 6 |
| 09/01/2014 | 2 |
| 10/01/2014 | 4 |
| 12/01/2014 | 1 |
When I ask for the last 7 days worth of sales in that data, I want to return the number 7, because:
- The newest data in the table is 12/01/2014
- Therefore I should consider dates back to 6 days before that, i.e. 6/1/2014
- There were 3 transactions in the time period 6/1/2014 – 12/1/2014, 2+4+1 = 7
Here’s one solution:
Make a table calculation iterates over the data and checks whether the date of the record is within the past 7 days.
Sales in last 7 days:
IF ATTR([Date])>=TOTAL(MAX([Date]))-6 THEN SUM([Sales])END
Putting DAY(Date) on columns and the above formula on text we can see it is correctly identifying the value of sales on the relevant days:
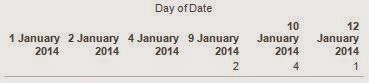
Then to sum the the 2, 4 and 1 up:
Sum of sales in last 7 days:
WINDOW_SUM([Sales in last 7 days],FIRST(),LAST())
Using this as the text value gives:

So it has clearly identified the correct answer of 7. You may well not want the number 7 written on every day though! Removing DAY(Date) from the columns breaks the table calculation. If it’s static data, you could just hide everything except 12 January. But then if it’s static data you probably aren’t faffing around with the above trying to make it dynamic.
So the solution to this is based on something I learned from the Tableau Jedi class, “table calculation filters”. Unlike normal filters, these are executed after calculations have finished.
Create another couple of calculated fields.
First, this identifies the date of the last sales record, here 12 January 2014.
Latest sales date
WINDOW_MAX(MAX([Date] ))
Then to enable the filter:
Table filter to last date:
LOOKUP(MIN([Date]),0) = [Latest sales date]
This will be true only in the case that the current record is the one with the same date as the newest sales date available, as you can see if we colour code the above table with it.

Now, just drag this “table filter to last date” field to filters and select to only show true, and you will have a single record with the correct value “7”.
As a bonus it will have a header showing what that most recent date was, but of course you can stop this and other headers from showing if you don’t want it.

Below an example Tableau twbx file with all the above in can be found here.
