Whilst Tableau is by far the best dataviz/exploration tool I have ever had the pleasure of using, I’ve traditionally felt it’s not so strong in the boring “enterprise” areas around governance, metadata management, documentation and so on.
It’s quite clear to me why – the tool is/was aimed at data practitioners wanting to bypass all that slow, boring traditional IT process where data can’t be used until it has gone through 6 months worth of paperwork, signoff, tedious discussions and other delays that tend to render it a total waste of effort :-).
This is exactly what it needs to do for most of its target audience – and very successful it is too. But sometimes, even data-progressive organisations might like to have at least a core of “governed data” that is centrally documented, validated and deemed the official source of truth, even whilst not restricting their analysts to use only those sources.
Tableau has a great mechanism for creating and distributing datasets securely enterprise-wide – via using the Tableau Server as a datasource provider – and has the ability to create implicit metadata such as hierarchies, datatypes, groups, sets etc. However it was not immediately obvious how to create a business-user understandable data dictionary.
Our organisation has tried to get around this by creating a datasource in Excel that is essentially a list of all official datasources, fields and much more. It lists, line-by-line, things like formulae used, human-readable definitions, original system of record, who is responsible for its governance, refresh rate, which dashboards use it, and much more.
The system works, but it is a very manual process, subject to human error and will not scale well if ever there was a data onslaught. The upside though to this method is it can then be published whenever desirable in a consistent manner. We use it both in a standalone “data dictionary dashboard”, and also as a mandatory worksheet at the back of every “official” Tableau dashboard released to general business users.
Why would you want a data dictionary?
So far, the main use cases for this dictionary here have transpired to be:
- When someone is interacting with a dashboard they might want to know the precise definition of the measures or dimensions they are looking at. For instance, is “sales” net or gross of tax? What system did it come from? How is currency conversion handled? If a customer used a discount voucher is that included or excluded? And so on.Even the simplest of fields seems to be able to generate many questions. For this reason, we make sure every official dashboard contains the relevant parts of the data dictionary as per the above.
- When an analyst is wanting to create a new dashboard, they want to know if the data they need has an “official” version and if so, where can they find it? So if they wish to know number of customers, which Tableau datasource would have that in, and what are the various definition options for it?This is the main use case for the standalone data dictionary dashboard, which allows an analyst to type “sales” in and find every data source and every definition of sales that have passed some form of governance.Of course if the field they want is not available, they can still use the flexibility of Tableau to find another way to integrate it from a more adhoc source – but they should be directed to an official source if there is one, rather waste time and risk errors/inconsistencies in building their own version.
- When someone who maintains a central datasource is wanting to change or enhance it for some reason, they wish to know which workbooks already use the datasource and hence which might be affected or need testing.
Tableau has built in features to enable a lot of this though
Thanks to a chat with the ever-helpful Tableau support team though, it became apparent that Tableau 9 (and indeed many versions prior to this, albeit not presented quite as nicely) has several features along these lines built into it. It’s not quite enough yet to fulfill especially the second use-case above – but the many advantages of being built-in might outweigh the missing features for some users.
Below shows built in solutions to 4 key questions that a user might ask a data dictionary type system to answer.
- What does this field mean?
- What’s in this datasource?
- Which dashboards use this datasource?
- Where did the data in this datasource originate, and when was it last updated?
What does this field mean?
Initial data setup [by data publisher]
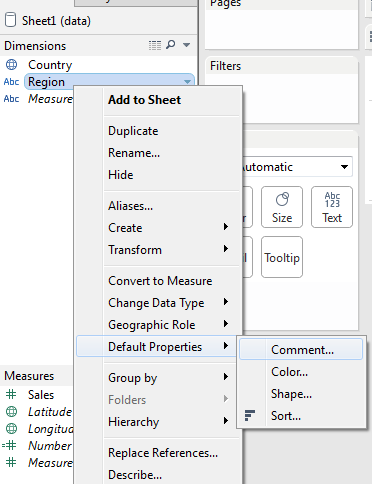
Within Tableau Desktop, every field can have a (manually entered) comment. To put this in, just right-click the name of the field, choose “Default properties” then “Comment”. In the resulting box, you can enter anything you like – so perhaps the business definition, any formula concerned, who governs it and so on.

Where will the end-user find this information?
I have seen it appear in 2 main places so far.
- When an analyst is designing a viz in Tableau Desktop if they hover over the field in the list or the pill on the dashboard then it is shown as a tooltip.
- When an analyst is designing a viz in their web browser via the online editing function


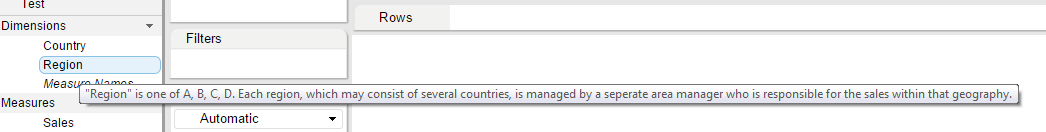
This hover-over functionality is awesome for analysts to quickly get a reminder of what each field they have access to actually means.
Unfortunately it does not seem to appear anywhere in the read-only view of Tableau server, so only people with permission to edit the workbook online will be able to see these descriptions, and they will have to put the workbook into edit mode (and be careful not to mess it up!) to do so.
Wishlist for Tableau 🙂
- Allow “Comment” to be populated by a field in the database – so one can store central definitions etc. that can flow into each datasource and remain consistent automatically if the same field is used in multiple datasources.
- Have an option to show-on-hover the description in the tool tip when a dashboard user is using the dashboard on the server. It’s been quite rightly pointed out that it is not always useful/good to have lengthy descriptions in the default tool tip of a visualisation when it can be used for other more interesting stuff. But perhaps there could be a button under the tooltip that says “show comment” or similar that would reveal it when it is needed.
What’s in this datasource?
Initial data setup
Each datasource also needs a description so that an analyst can get an overview of the content, recency, granularity etc. at a glance. This can also be done in Tableau at the stage where one uses the “publish to server” functionality of a datasource to push it to the server as a datasource.
You will be presented with a box allowing you to describe the datasource as a whole as per the below.

Fill that in and hit publish and it’s done.
Where will the end-user find this information?
- In Tableau Desktop, when you choose to get data by connecting to a Tableau Server, it lists for you all datasources available on the server. There is a tiny “i” symbol next to the name of the datasource. Hover over that and you will see the description.
- On Tableau Server, if you go into the “data sources” section, click on the name of the data source concerned, and choose “details” on the top right it is shown there.


Wishlist for Tableau
- Make this more discoverable as an end user. Have some optional function in the datasources list in desktop and server to list all of these descriptions to allow the user to chose the most appropriate datasource.
- Perhaps make it searchable so I can see all datasources to do with “sales” [noted that this is one possible good use of tags]
Which dashboards use this datasource?
Initial data setup
There’s nothing to do! Tableau Server keeps track of this and shows it to you very nicely. Very useful if you are needing to change a datasource and want to know which workbooks are likely to be affected.
Where will the end-user find this information?
In Tableau server, if you go to the data sources section and click on the name of the datasource you’re interested in. Make sure “connected workbooks” section is selected and it will show you all the workbooks that use this datasource.

Where did the data in this datasource originate and when was it last updated?
Initial data setup
Again, in general there’s nothing to do! Tableau Server will keep track of this and show it to any user entitled to view the datasource section.
Where will the end-user find this information?
Go to the data sources section in Tableau Server. Here it will show you each datasource that was published including:
- its name (as chosen by the publisher)
- the original type of database it came from (e.g. Oracle, SQL server, Excel)
- which database server/file it came from – the case of file based systems like Excel it records the file name.
- Whether’s it’s live or an extract, and if an extract, when the extract last ran.
- Which project it’s associated with
- Who owns it (“owns” in this sense just means who published it to the server)
- When it was last modified

A small subset of this information is also available in Tableau Desktop in the Connect to data -> Tableau Server screen where one chooses which source to use. In there you see the name, the owner, the project and last modified date only.
Wishlist for Tableau
- Not a biggie – but would be nice if (optionally?) the full set of info shown in Tableau Server was presented in Tableau Desktop when connecting to such a datasource
Summary
Although a lot of this existed in version 8, the version 9 server interface makes it ever easier to see and understand your data sources. I would still suggest that Tableau is not super-fully featured when it comes to data dictionary type governance and – whilst understanding this is not at all their primary focus – I hope they go even further with these efforts in future.
But, especially if you have a low number of governed datasources, or they have little duplication between them, it may well be worth your while using the above features to create some inbuilt documentation and validation of appropriate data source. This will make your analysts’ lives safer and easier all being well. It’s also a much nicer approach than if you have to go to the effort of trying to design some more comprehensive, but painfully manual, system.
There are of course other products e.g. that sit on ones’ intranet that are specifically designed for this sort of governance (if you have the money to spend). However, they’re unlikely to enable the sort of hover-over tooltip definitions during the viz design process that is so conducive to the analytical flow that the inbuilt features of Tableau would.

Your points are right on!! I have aded ideas to Tableau requesting the hover over label function to allow data definitions from various sources, including iData’s Data CookBook. Now we just need Tableau to respond when they will address and implement.
LikeLike