Liam Thorp, political editor of the Liverpool Echo, was recently surprised to receive an invite to receive a Covid-19 vaccine. Whilst the UK does seem to be numerically ahead in absolute terms of many (but not all) other countries when it comes to at putting first-doses into people, we’re still at the stage where only those people deemed particularly vulnerable to the disease are supposed to be receiving it. There’s a fairly popular vaccine queue calculator doing the rounds which currently suggests a relatively non-vulnerable person is probably going to get an invite for their first jab in May or June. Not February.
Mr Thorp didn’t consider himself to be in a vulnerable category so followed up with the authorities as to why he had been invited at this early stage. It turns out he had been classified as having a risk factor that made him vulnerable; namely having a Body Mass Index of 28,000 kg/m2. Ahem.
The standard World Health Organization BMI classification guidelines have adults with a BMI of over 40 as being in the most obese category, “Obesity class III”. In 2014, the person thought to be the heaviest man in the world had a BMI of 187.3 kg/m2. The fabulous reference that is Wikipedia lists a couple of folk who had BMIs in the 200s. In short, it is entirely impossible in the real world for a human to have a BMI in the twenty-eight thousands. And not just a bit impossible. Fully “very obvious error” impossible to anyone with some domain knowledge; i.e. the type of person one would deeply hope was involved in organising the vaccine invite letters.
So what had happened? Turns out it was classic entry in the data analysis errors canon; namely assuming the units of a stored value is something other than it really was.
The gentleman in question had registered with the NHS as having a height of 6 foot 2 inches, which is around 198 centimetres. However, his height had somehow been entered into the relevant computer system as 6.2 centimetres. BMI is calculated as weight in kg / (height in metres squared). So a wildly low height leads to a wildly high BMI.
6.2cm is another definitely not possible database entry. The world’s shortest verified human is about 55cm tall, or at least that was the case in 2012. It’s easy to see how the mistake was made – quite probably whoever was involved in the process of getting the data into the system never imagined Mr Thorp was actually 6.2cm, but fell prey to the interface allowing very impossible entries. In this case domain knowledge probably wouldn’t have helped. Or possibly there was another reason; some database update script doing unfortunate things in data updates, some upgrade going wrong – who knows? But whatever the case, a medical system that potentially contains lots of critical information should likely have been built so as to disallow, or at least provide lots of noisy red alerts, entries that are very very impossible.
Nonetheless this sort of thing happens in the real world plenty. I often analyse weight data myself – not for the NHS but certainly for an organisation where this datapoint is important. And, at the granularity of per analysis, it’s certainly not uncommon to see chronological strings of self-reported weight entries for a particular person over time that read like 250lb, 249lb, 148lb, 247lb, 248lb. Did you spot the odd one out? Whilst those weights are all in theory possible weights for a human, almost certainly the data enterer mistakenly typed a 1 instead of a 2 as the leading digit of the third weight there.
Saving face with assertive programming
So, what’s an analyst – who typically may not have the ability to directly fix whatever system is permitting these sort of entries into the database in the first place – to do? Well, sure, definitely campaign to change the system to avoid or fix these issues. But in the immediate term, one might use “assertive programming” to ensure these obvious mistakes don’t find their way into your analysis, corrupting individual’s data or overall aggregates as they go.
As a brief summary, in assertive programming, one codes in “assertions” of things you know should be true. In the case that the code determines they are not in fact true in your dataset, running the code will typically provide loud warnings, or usually even better, generate errors and fail to run. Annoying, sure, but better you have to dig into dirty data than you produce analysis that is embarrassingly impossible, or, even worse, technically possible but wrong, prospectively leading to decisions that are also technically possible but wrong.
In R, one useful built-in base function for this is the stopifnot command. Enter a predicate into this function, and if when the code is run the predicate is not true, then it’ll call the stop function. This stops code execution and returns an error. A situation like that described above could potentially have been avoided via code like this:
# create a dataframe with some sample data in
height_data_cm = data.frame(height_cm = c(150.2, 140.0, 160.2, 6.2, 180.2, 163.0))
# assert that heights are between 50 and 280 cm to proceed. Quit if not.
stopifnot(height_data_cm$height_cm >= 50, height_data_cm$height_cm <= 280)
# display the mean average height
mean(height_data_cm$height_cm)
It’s the second line that does the magic there. If you don’t have that line and run the script, you get an output of 133.3. That is a plausible mean average height in cm, kind of. But it’s likely not the correct average height for the people in this dataset. The 6.2cm height is evidently faulty.
The second line would prevent us accidentally calculating and reporting that mean. Potentially this is less needed when you have 6 heights you could manually review and an analyst with the will and focus to do so, which is another option in these circumstances. But it’s a lot more required if, like the NHS, you likely have tens of millions of individuals contributing height-related datapoints in your population.
So if you do include the stopifnot line running the script returns an error, telling you that it’s not the case that the two conditions included in the parameters of the stopifnot command – that heights are greater or equal to 50cm or less or equal to 280cm – are all true..
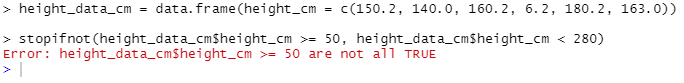
The mean isn’t calculated. The script is stopped and there’s no risk of reporting a mean of 133.3 in your fancy presentation.
Whilst stopifnot works well for many simple cases – you can put any number of conditions in it and if at least one of them isn’t true then everything halts. But R being R, there are of course many freely available packages that further facilitate this type of assertive programming, potentially in more flexible, fancy or readable ways.
I personally have used the assertr package which contains many useful functions to assertively check on your data in a comprehensive way. Perhaps we’ll go deeper into this in a future post, but for now, here’s a quick example of how you could write the same check from above using methods from that package (after you installed the package, which can be done via cran).
library(assertr)
height_data_cm = data.frame(height_cm = c(150.2, 140.0, 160.2, 6.2, 180.2, 163.0))
assert(height_data_cm, within_bounds(50, 280), height_cm) # assert that heights must be between the bounds of 50 and 280 cm
mean(height_data_cm$height_cm)
When we run this code, we can see that once again execution has halted. Furthermore, in this case, a more informative message is returned that tells you which assertion was violated – useful if you are performing several checks at the same time – and the details of the specific datapoint that did so.
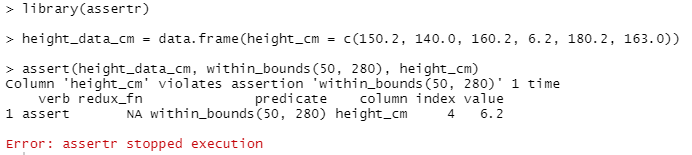
The reason the message tells you about the verb, predicate and column is because you can run several complex checks simultaneously with this package. For example, perhaps you want execution to halt if there are fewer than 1000 datapoints, the category field contains values other than “A” and “B”, or any height variable entry is more than 5 standard deviations from overall mean. In that case it helps to know which assertion failed on which record.
The latter point hints at another option – there are many methods (and packages) for outlier detection, which would also likely have picked up the 6.2cm issue above. However, these are often based on distributions of data rather than domain specific knowledge about what is or is not literally possible in your dataset, so I prefer to use this style of assertion in the case that there is pre-existing knowledge of what is an acceptable value. Outlier detection can – depending on method and datapoint – be somewhat conservative for this use-case. Often it’s more useful as a tool not just to exclude bad data, but also highlight interesting unusual but real cases that are worth investigating rather than dropping.
If you’re not an R, Python and other scripting languages will certainly have some similar functions – for example, Python’s assert function. For other tools, well, at the end of the day, basic assertions are really a special case of if / else statements. If <something that shouldn’t happen> is true then <raise and alarm and don’t proceed>. So any tool with that kind of basic conditional functionality can probably be persuaded into doing the basics.
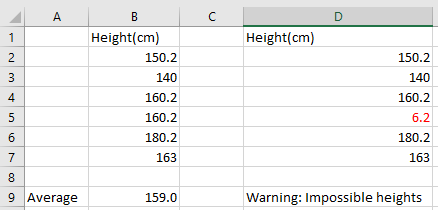
For example, if your height data was in Excel, then instead of calculating the average height via something like AVERAGE(A2:A7), you could introduce a check that would at least warn you if something was up via a formula involving the IF function. Ensuring the heights are within the bounds outlined above, and calculating the average only if they are, could be expressed in this way:
=IF(OR(MIN(D2:D7) < 50, MAX(D2:D7)>280),”Warning: Impossible heights”, AVERAGE(D2:D7))
That’s to say, if the minimum height in the list of heights is < 50 or the maximum is > 280, write a warning message, else calculate the average. Just like the below. Note how the average works just fine for column A, but if we see the infamous 6.2cm person appear in the dataset as per column D, we a warning instead of an average.