Excitement builds within the dataviz world as the next version of Tableau gets close to launch, supposedly within the next 60 days.
It has many new features, which data geeks and other fans can see an preview being dripped out piece by piece in the Tableau blog, and summaries elsewhere, but one has really caught my attention, even though it is probably on the less glamorous side of things.
The general topic is “level of detail” calculations; a new type of calculations in the forthcoming version of Tableau, which I first saw in action via the Information Lab’s wonderful preview video. All the ones I’ve read about so far (INCLUDE, EXCLUDE, ….) seem that they will be very useful indeed for such super-common analytics tasks as comparing something with a larger group of somethings it’s part of, but potentially most thrilling to me is FIXED.
These calculations are interesting to me in that they provide a way to use data from other rows of data to calculate something in this row. Tableau table calculations can do some common cases of this, e.g. TOTAL, WINDOW_SUM et al. but not yet flexible enough to what I imagine is necessary for most in-depth analysts on a regular basis; specifically accessing data at a pre-defined granularity not included in the visual analysis design itself that is neither “current row” or “all rows” – but something in-between.
Of course, not proclaiming to be a leading Tableau expert, it could simply be that I don’t know the easy way of doing it in Tableau today so comments most welcome if I am missing something obvious – but even with various training and Tableau doctor sessions a few questions remain unsolved in my mind.To highlight this, I’m going to steal something very similar (but far simpler) to the example Tableau gave in their 3rd example here, about sales by customer tenure.Imagine a very simple table like this:
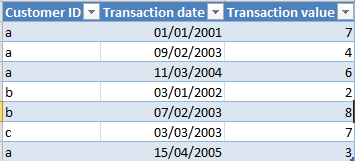
And now that you want to know the total transaction value for these customers based on their first transaction date. The business question might be something to the effect of “Are our newer customers bringing in the same level of revenue as our older ones?”. This silly sample data is so small it’s trivial to calculate in ones’ head, but you can imagine many real life equivalent tables that consist of millions of customers and hundreds of millions of transactions.The sort of data structure that would make it wonderfully easy to calculate this today in Tableau would be to add another column, e.g. “first transaction date”. This could then be used in a dimension so that one can pop it on rows, colours, shapes or what have you, put transaction values into the measures and play away.

Note the point here is that every unique customer has the same “first transaction date” in all their records, whereas the actual transaction date varies as they buy more products over time.
That column is very easy to calculate in Excel and its ilk. But, today, it does not seem so easy to calculate that in Tableau in aggregate to answer such seemingly simple questions like “how much did customers whose first transaction was in 2001 bring us over their lifetime so far vs those starting in 2002? “.
To be fair, with small examples like this it’s usually easy enough to do this even in current Tableau by creating a series of Tableau calculated fields and using them in Tableau sets to represent all customers with a minimum transaction date of a certain year. I’m not going to write about that here, as hopefully I won’t need to do it ever again in the near future! I’d note though that, as well as being as intuitive as most of Tableau is, in the real world this technique does not seem to scale at all well, for instance when you have large number of customers who joined in many different years. I have even managed to get Tableau to tell me it’s out of memory whilst trying to doing this sort of thing with too many records, which is a very rare occurrence indeed.
So personally I have tended to force myself to switch to other tools to pre-build this extra column when I need to do something like this in Tableau.
I’m all for using the right tool for the right job, and there are many great tools available. No serious data-person should restrict themselves to a single tool. However I haven’t experienced an ad-hoc visualisation tool I like nearly as much as Tableau, so I end up spending time taking the data from Tableau out to a another tool just to make a file to re-import back into Tableau.
Unquestionably, doing so interrupts the flow of analysis, and can be a proper time-sapping pain if the source of your data is for instance a TDE or something else that most other packages don’t natively open. Here’s a reference list of some tools and methods I’ve to do this successfully in the past – and probably will continue doing so for the next 59 days or so.
Microsoft Excel: I probably don’t need to explain what this one is, to anyone who read as far down as here anyway!
Example method: many possible options, 1 of which would be this style of array formula if we are sure no transactions in the year 2099 or afterwards exist in the dataset.
{=MIN(IF(Sheet1!$A17=Sheet1!$A$13:$A$19,Sheet1!$B$13:$B$19,DATE(2099,1,1)))}
Pros:
- Very easy to do, most analysts will be able to create a formula for this very quickly.
- You probably already own the software.
Cons:
- Excel cannot handle files with over 1 million rows, and it begins to struggle long, long before that.
- Generally will have to re-do or extend the formula when the rest of the data updates. Excel has some live-linking abilities, but I’ve never found them terribly reliable.
- As ever with Excel, because it’s so easy to use and supremely flexible about most things, it’s easy to make a mistake, not notice and hence create inaccurate analysis. Imagine if you forgot the dollar signs in the above formula!
SQL server (or other RDMS):
Example method: again many possible options. 1 of which could be:
SELECT data.[Customer ID], data.[Transaction date], data.[Transaction value], data_copy.FirstTransactionDate
FROM data
LEFT JOIN
(SELECT [Customer ID], MIN([Transaction date]) AS FirstTransactionDate FROM data GROUP BY [Customer ID]) data_copy
ON data.[Customer ID] = data_copy.[Customer ID]
Pros:
- Very often my data is coming from a SQL server anyway, so why not retrieve and manipulate it in one go?
- Performance CAN be great over even large datasets
- You can include data updates just by refreshing the query
Cons:
- SQL is not a visually intuitive language. Personally I would recommend most analysts who have access to relational databases to take the time to learn at least the basics – but beyond the basics it can certainly get rather complex and take a lot of thinking and debugging time that could be better spent in providing insights. Especially for the case where you are running against a database that was designed perhaps for operational or transactional reasons, and not aimed at analysts.
- SQL servers in companies are often centrally maintained by a technology department and may be being used for many non-analytical yet mission-critical tasks by many other people. Business analysts do not always have a good amount of control over those environments; for instance I have effectively low priority read only access a lot of ones I use.
- For the above reason, you may need a lot of documentation to understand where to look in the database; badgering the database managers for data dictionaries, entity relationship diagrams and other complexities takes time on both sides. It might well be that such documentation doesn’t exist. And then “educated guessing” is about the best you can do.
- For the above reasons, performance CAN be terrible depending on what you want to do
- Accessing a remote SQL server can’t be done if you have a dodgy internet connection or outside firewalls in some cases (think ‘travelling’ for instance).
- Some SQL databases or licenses may be very expensive, if you don’t already have access to one.
Example method:
=CALCULATE(MIN(Table1[Transaction date]),ALLEXCEPT(Table1,Table1[Customer ID]))

Pros:
- Is a free download
- It fits directly into Excel, so relatively user friendly and easy for any decent Excel user, especially those who pride themselves on pivot table skills.
- It enables Excel to handle a much bigger volume of data and introduces new functions that can be used for many useful things that standard Excel pivot tables can’t do.
- Everything seems to be precalculated so performance can be extremely good after the initial setup of your data is done.
- The language it uses for formulae, DAX, is for the most part pretty similar to standard Excel functions where it can be.
- The CALCULATE() function used above uses a syntax I find very intuitive, flexible and really like a lot; possibly my favourite implementation of a feature like the ones you need to do this task.
Cons:
- You, and other people who want to manipulate your Excel file if any, need to have Powerpivot addin installed. This needs downloading and temporary admin rights if you’re running Excel 2010. I have no experience with Excel 2013 variants.
- Formulas in Powerpivot are written in “DAX” language. DAX is not a language that all that many people speak in my experience (although the basics aren’t complicated).
- The version you can use seems dependent on other Microsoft infrastructure. For instance, for me, I am restricted to the 2008 version due to other software that runs. 7 years is a LONG time for analysis tools!
- Behind the scenes it is creating something similar to a SSAS cube. This means that when you connect Tableau to it as a datasource you suffer the loss of many of Tableau’s finest features, as it’s effectively an OLAP cube. Many of Tableau’s competitors won’t connect to it at all.
- The big showstopper for me: it’s an in-memory software I believe, so if you try and use row-scanning operations like the CALCULATE() formula above, especially with a FILTER() over millions of rows I have consistently had “out of memory” errors. This means it whirs away for half an hour and then gives the error message and totally refuses to do what you asked it to. I come up against this a LOT. To be fair, maybe a version that isn’t 7 years old has far better performance than this one, but sadly with our current infrastructure that’s not an option for me. It can handle data far bigger than native Excel without question, but it still seems to have a limit that one comes up against frequently even when not dealing with mega-terabyte-Hadoop type stuff. I would love to see if new versions of it have helped on that front at all as it’s a great tool for it’s (non-existent) cost.
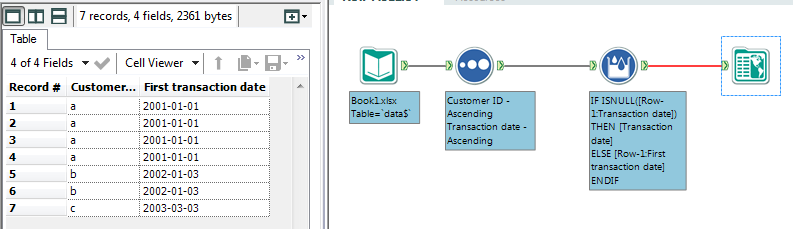
Example method: Alteryx files look like visual flow charts, so below an example picture. One option for the crux of the matter is probably a multi-row formula tool with the following formula, grouped by Customer ID, after the data is sorted by customer ID then transaction date.
IF ISNULL([Row-1:Transaction date]) THEN [Transaction date] ELSE [Row-1:First transaction date] ENDIF
 Pros:
Pros:
- It is blazing fast. Really, really fast. I have seen instances where the exact same task as made PowerPivot crash out of memory after 20 minutes has been completed successfully in under 30 seconds in Alteryx.
- After a little experience, the flowchart interface is easy to use and I find I make fewer mistakes here than in some other tools.
- If you need to repeat it with updated data, just re-run the Alteryx routine and you replicate the results without needing to recreate or edit anything.
Cons:
- If you don’t already have it, and most people don’t, Alteryx isn’t the cheapest of tools. I think the “normal” version is around £2500 per user these days. Definitely not over-priced for what the package can do – but obviously it is not cost effective if your only task really is to add a column to a table once!
- The interface is very different from many “normal” tools, which means it might put many inexperienced users off trying it out unless they really need to.
- Super-petty criticism, but on my computer it takes a relatively long time for Alteryx to load and get itself into a usable state; a definite “flow interrupter”.
Tableau 9 (my hope):Example method: I didn’t get around to installing the beta test version yet so this is assumed from reading the blog posts of many wiser people than myself – but if I understand correctly it will take just <=6 little words (depending on how you count).
{Fixed [Customer ID]: MIN([Transaction Date])}
Pros:
- If this is true, then you won’t have to leave Tableau – and your flow of analysis – at all to do the task.
- It will refresh as and when the data does, and work offline with extracts or online without.
- Typing the above in will take approximately 5 seconds or less!
Cons:
- None come to mind, although I have one potential concern; that of performance. Functions like this I would assume have to scan over a lot of rows to get the result. Tableau has (almost) always seemed a very fast tool to me so I’m optimistic – and Alteryx has shown these functions can run superfast – but I’m curious to know how well these type of “level of detail” functions work over medium-large datasets (100,000s – 10,000,000s of rows). I will look forward to finding this out in the not too distant future.
Either way this feature will surely save me, and I’m sure many many others, an incredible amount of time on very common, and quite dull, analytical tasks. I am grateful indeed.

Your hope is not misplaced. I’ve worked with the beta (and even the alpha before that, at which point I had a hard time containing my excitement!) Performance is definitely a concern. I’ve been working with mostly smaller data sets and extracts and so far, I haven’t had any issues with LOD calcs. But I would imagine that larger data sets might start to show degradation. At the same time, Tableau 9.0 introduces a host of performance enhancements (parallel queries, query fusion, and the like) that might provide an offset.
LikeLike
Thanks – great to hear it’s as exciting in reality as it is in my mind! Any performance improvements of any kind always most welcome 🙂
I got the chance to speak to someone from Tableau recently; she wasn’t an engineer so didn’t have full details of LOD internals but mentioned that at least FIXED (but not INCLUDE/EXCLUDE) could be calculated once and cached. So hopefully even on bigger datasets, even if it does take a long time to FIX at least it shoild only have to do it once.
Can’t wait to experiment!
LikeLike