One that is very common within businesss and elsewhere would be to check some value, for example sales revenue, against the same value within the same time period last year. “Same time period last year” can be very important for any sort of analysis where annual seasonality is in play. For example the period of time just before Christmas makes those weeks very profitable for some retailers, and it would be nonsense to take pride that one sold more on the week before Christmas versus on slow-sales summer holiday week.
Tableau and most of its competitors have nice features for dealing with dates in that context. Here’s a nice blog entry showing how simple it is in Tableau to do a prior year comparison in basically 1 click.
However, it appears become a little more challenging when a) your data is not actually associated with a date, and b) your business calendar does not really tie up with a “normal” calendar as defined in Tableau or any other sort of standard way.
Specifically, the data I need to use is at a weekly granularity; with each record showing a fiscal year and a fiscal week.

In most circumstances this remains a simple operation, because one can easily filter on all the week [X]s and have the software calculate the % difference over the years for any given week.
However, reality complicates things further: to take into account leap years and other such annoyances, our fiscal calendar sometimes has 52 weeks in a year and sometimes 53. The fiscal calendar is set in stone.
- 2015 has 52 weeks,
- 2014 had 53
- 2013 had 52
- 2012 also had 52.
Note that just because a year is a leap year, that does not mean that it has 53 weeks in the fiscal calendar!
The rules are such that when the 53 weeks are involved then no longer is it a valid comparison for my use case to compare week X this year with week X last year. Instead, it becomes necessary to compare to week X+1 in the previous year.
So as a concrete example using the data above, let’s say I want to look at the sales data for fiscal week 3 2015 and see how it compares to the prior years by calculating a like-for-like % difference. This table hopefully explains what has to be done to get the % growth value desired.
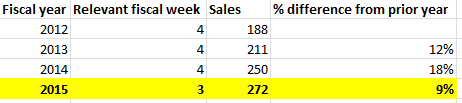
First we have to identify the correct weeks to compare. We start with fiscal week 3 2015. Having established that 2014 had 53 fiscal weeks, we now know that the comparable week in 2014 was week 4. The comparable week in 2013 was also week 4 because 2013 had only 52 weeks, and so on. Notice that the correct figures we want are 9% growth between week 3 2015 and week 4 2014, and 18% growth between week 4 2014 and week 4 2013.
So the question is how to automate implement this rule in Tableau so that only these valid like-for-like comparisons are shown, not only for these years but for the rest of eternity.
So far I have tried 2 approaches. Both work for the limited scenarios I need them for – but neither of seem satisfactory in a general sense. In the interests of self-reminding documentation here they are shown below. If any kind internet-wanderer immediately notices I’ve missed a far more obvious and better solution, telling me so would be most welcome!
Attempt 1 – use a parameter to let someone choose the correct relative week to compare to.
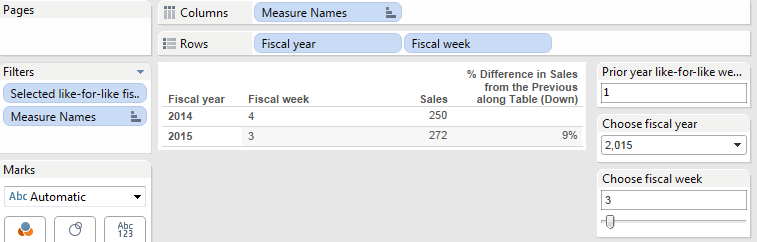
I have a parameter called “prior like for like week modifier” that when set to 0 will mean that one should compare this year’s fiscal week with the same fiscal week last year. Right now in the GM dashboard it is set to 1, meaning add 1 to the fiscal week number this year to understand which week it should be compared to last year.
Then I created a calculated field called “Selected like-for-like fiscal week flag” which should return “true” if the record we are considering is either the currently selected fiscal week or the equivalent one to compare to in the prior year.
([Fiscal week]=[Choose fiscal week] AND [Fiscal year]=[Choose fiscal year])

OR<

([Fiscal week]=[Choose fiscal week] +[Prior year like-for-like week modifier] AND [Fiscal year]=[Choose fiscal year] - 1)
This is then used as a filter set to true for any worksheets that need it.
Here’s a picture of it in action, and note it is correctly displaying the 9% figure for comparing the sales in week 3 2015 vs the comparable period of week 4 2014.
Advantages:
- It lets the user select exactly which week they want to compare to. In fact they could choose to do a different time frame calculation instead of year vs prior year if that was a valuable feature to them. It’s also possible to hide the worksheet with the parameter on before publishing to Tableau server so there is no risk than a “normal” viewer, who is not interested in why this works, will try and change it.
Disadvantages:
- Requires manually changing when the difference alters (no more than once a year of course, but one has to remember to do it!)
- Doesn’t scale to multiple years, i.e. if the dashboard has to allow you to compare 2015 with 2014, and 2014 to 2013, and 2013 to 2012, then the offset would be different for each year, and so can’t be represented with a single parameter. It may be possible to add a parameter for each year (e.g. “2015 modifier”, “2014 modifier” etc. but that seems like a lot of work if you are wanting a dashboard covering the past 20 years for instance.
- Only really works intuitively when showing a 1 week summary; it’s not easy to see how to construct a time series out of this.
Attempt 2 – table calculation to take advantage of the fact the duration between the valid comparison weeks always remain the same
The rules concerning years with 53 and 52 weeks can be summarised by saying you should always consider that if one was to lay the weekly calendar out from start to finish then you would want to compare your current weekly data with one from 52 “spaces” in the past. This implies the correct outcome in a year after the 52 week year you are comparing to the same fiscal week number of the prior year, whereas in a year after the 53 week year you are comparing to the “fiscal week + 1” number of the prior year.
Therefore, with a correct layout, one can adapt the % difference from Tableau table formula like this:
(ZN(SUM([Sales])) - LOOKUP(ZN(SUM([Sales])), -52)) / ABS(LOOKUP(ZN(SUM([Sales])), -52))
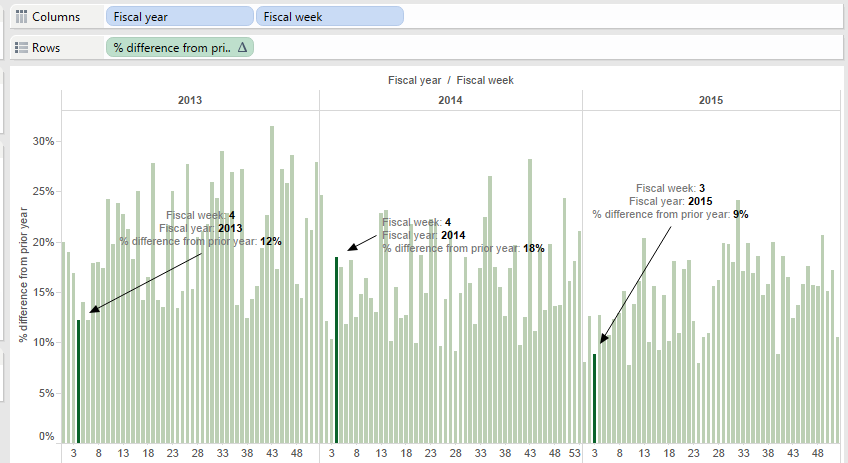
Here’s a picture of it in action, note the annotate points are displaying the correct % growth as defined above.
Advantages:
- Does not require the user to input any parameter
- If the “52 spaces before” rule works every year then it will never need to be updated
Disadvantages:
- Tableau is not aware that these fiscal years and fiscal weeks numbers relate to actual dates. Therefore it is really looking 52 datapoints backwards, not 52 weeks. If there is an entry every week for a metric then 52 data points = 52 weeks so everything works nicely. But if there was a missing datapoint, for example imagine there was a week with no sales at all so there was no row for that week, then 52 data points would actually be 53 weeks. This would mean the calculation would be wrong and, worse yet, probably quite hard for the user to notice that.
- It means you have to have all 52 weeks in the view of the chart – although one can use the “hide” function or a “Jedi”-style table calculation filter trick to make sure the end users doesn’t see it if necessary. I suspect this causes slightly poorer performance if you have a lot of data, but so far Tableau has been more than fast enough that this isn’t an issue in reality.
Summary and conclusion
Both of these methods seem to work for the precise use cases described, but they also both have limitations such that they can’t be described as a set-and-forget general solution to the problem. Better ideas are most welcome. An example Tableau file implementing both of the above can be found here if anyone is kind enough to dabble.

Great article that is the best I’ve seen that explains the nuances on Tableau prior year calcs.
Good work!
LikeLike