From some combination of the Office of National Statistics, the House of Commons and Durham library comes Constituency Explorer.

Billing itself as “reliable evidence for politicians and journalists – data for everyone”, it allows interactive visualisation of many interesting demographics/behavioural/political attributes by UK political constituency. It’s easy to view distributions and compare between a specific contstituency, the region and the country on topics like
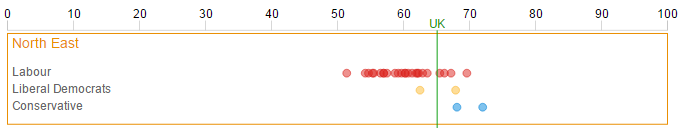
- 2010 election results (turnout and results)
- vehicle ownership
- age
- ethnicity
- travel to work
- household composition
- qualifications
- etc. etc.
Each chart has also a “download this data” link at the bottom left, which I would assume should give you a nice integratable spreadsheet/xml/something – but at the time of writing unfortunately one gets a “not found” error…
There’s also a fun “how well do you know your constituency” quiz which is nice for comparing one’s media-fueled perception of a given area to reality.
