Here in the UK we just had our general election, electing the government who will rule over us for the next 5 years.
The results – a Conservative majority – were something of a surprise to most people, myself included. I’m sure I won’t be able to hide my leanings for long, so to be clear, I’m not overly pleased with it.
But that aside, it raised many questions on data, as well as politics. It’s most likely too early to answer the question the title asks but here are some outpourings in the heat of the moment.
Why does everyone on my Facebook feed hate this presumably popular result?
What might seem weird to the uninitiated who have social media feeds along the lines of mine is that it would seem at first sight that nobody at all voted for the Conservatives, and nobody at all is happy with the result. Nothing but messages of hope (pre-election) and despair (post-election) were seemingly present on Twitter, Facebook and the like.
The photo below, from protests on the weekend after the results were announced, does not show a crowd happy at having participated in the democratic process (as is reported here and elsewhere). The imagery is intense; I do not remember such outbursts after other UK elections in recent times. 
The main explanation for the social media discrepancy though is probably easy – the filter bubble effect.
Made most famous by Eli Pariser in his book of the same name, the concept is, on the internet, and most especially of all on social networks, we are inadvertently (?) colluding with algorithms such that we will see only content that we are interested in, which tends to be the same content as reflects our existing preference, beliefs and so on
. Search engines will learn what we like to click on and give us more of it, Facebook will learn what we “like” and fill our feeds with it, and indeed we ourselves will bias towards only following our “friends” on Twitter, Facebook and the like, who – perhaps via the nature of our tribalistic legacy as written about extensively by the likes of Johnathon Haidt in “The Righteous Mind” and more – tend to be more like us than the average person in the world is.
The obvious analytical lesson from this – not that it should need saying – is that the rush of sentiment one receives upon viewing one’s newsfeed may be entirely unrelated to the majority opinion on the same subject – even before we consider the demographic biases of people who choose to use each network.
So forget that – time to start with basic facts.
How many people actually voted for the winners?
The first thing to establish is actually how many people did vote for the winning party?
At first sight, you might think that most people must have, considering they won. Of course this isn’t the case.
The BBC is a decent source for these figures, for instance here. Although they won 51% of the Parliamentary seats and hence the overall balance of power – the actual vote share for the winning party, the Conservatives, was actually 36.9%. Therefore around two-thirds of voters actively voted for a party that did not win.
The reasons for this discrepancy are widely known and debated, not least the crazy results that the UK “first past the post” electoral system – seemingly designed for the days when there were really only 2 significant parties instead of (perhaps being generous…) 6.
Many people and organisations do not find this acceptable, including the Electoral Reform Society. It’s easy to see why when one checks the ratio of votes case to seats won. Courtesy of the Telegraph:
| Party | Votes per seat |
|---|---|
| DUP | 23,032 |
| SNP | 25,972 |
| SDLP | 33,269 |
| Conservatives | 34,244 |
| Labour | 40,290 |
| Sinn Ffein | 44,058 |
| UUP | 57,467 |
| Plaid Cymru | 60,564 |
| Lib Dem | 301,986 |
| Green | 1,157,613 |
| UKIP | 3,881,129 |
(the chart they accompany this with is so appallingly designed it does not deserve to be replicated!)
This can be interpreted as meaning that more than 100x more votes were received per UKIP seat won than per the winning party’s seat won. Although personally I wish that UKIP would just give up and go away before they cause more hatred and harm, it’s easy to see why this causes resentment amongst their supporters and those of the other parties that got an order of magnitude more votes per seat won than the winners.
Next step: turnout.
People are not forced to vote in the UK. In reality, just 66% of people voted.
Neither party chosen or votes cast were evenly distributed over the country though. In terms of turnout – Scotland, for instance, had on average a higher % turnout at 71.1%. It also includes the only 2 constituencies where over 80% of eligible people voted.
Scotland has 59 constituencies and only 1 returned a conservative MP. So in some of the areas where people were most likely to vote – perhaps because on average they cared more about the result – there was effectively almost no support for the winning party.
However, the formation of Parliament has no relationship to how many people turn out to vote, perhaps somewhat ironic when some of the winning team consider other types of elections invalid unless a certain % of people not only turn up, but vote a particular way.
So the overall percent of eligible people who actually voted for the winning party is 37% of 66% which is 24%. Therefore, in an unrealistically evenly-distributed country, less than 1 in 4 people you might randomly meet on the street actually voted for the winning party.
What sort of people voted Conservative?
Fortunately (or perhaps not…see later) various organisations take poll upon poll upon poll of people’s voting intentions over time, so despite the importance of the secret ballot, we can see which way people say they are going to vote before the election actually takes place.
Polls of course talk to a very, very small subsample of those eligible to vote, but the various organisations have clever mathematical ways and means of extrapolating this in an effort to represent the whole population.
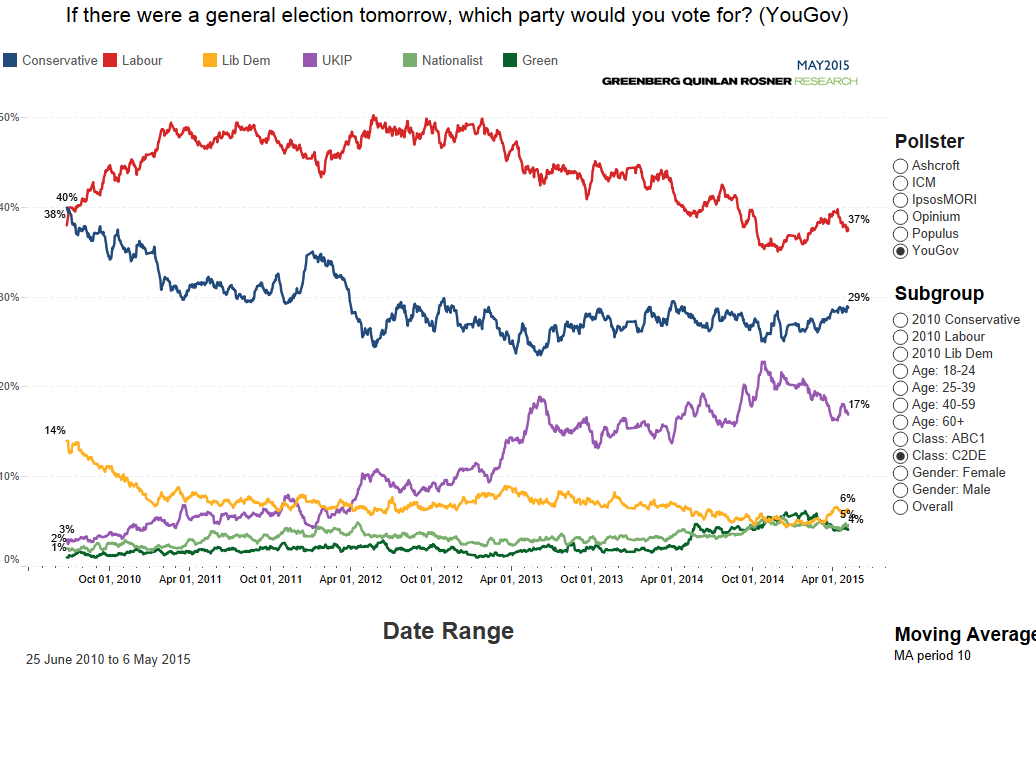
The wonderful Tableau Public hosts an interactive chart of these polls taken by 6 of the main polling organisations which allows breakdown by certain demographics.
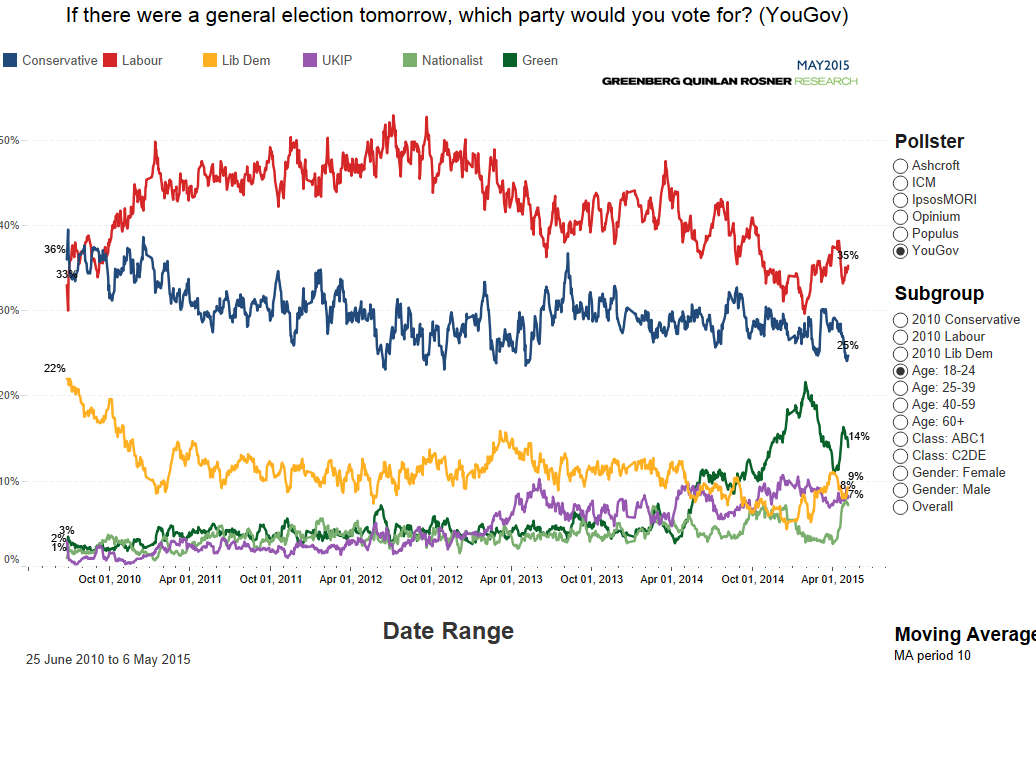
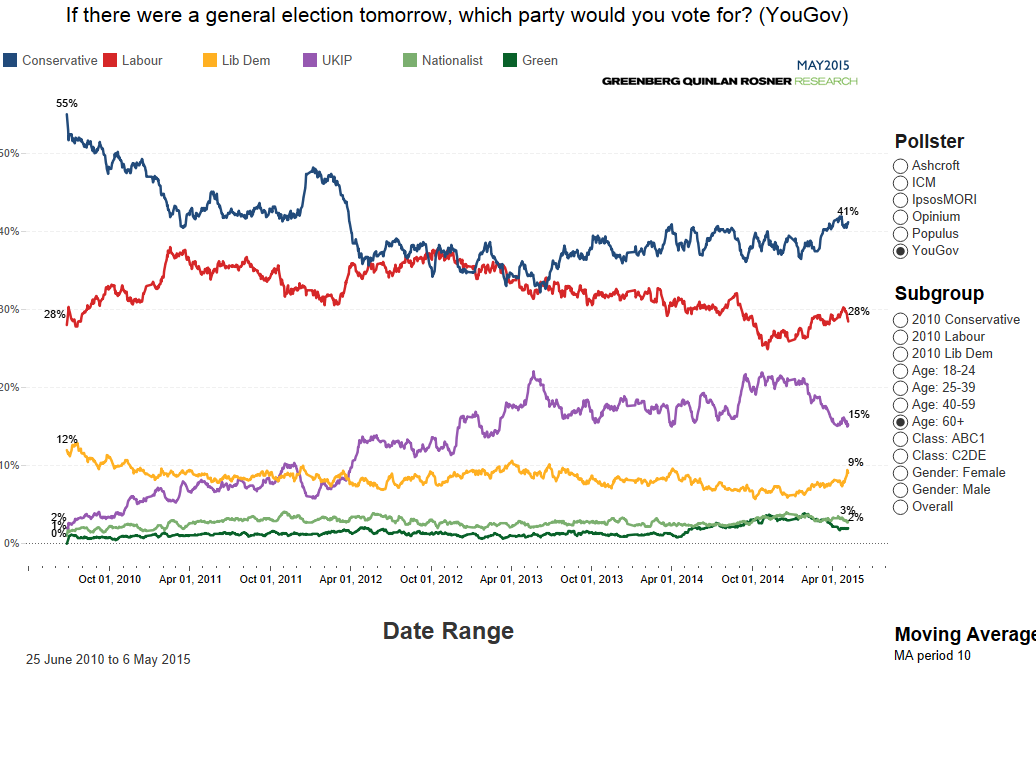
Sadly the data does not seem downloadable directly, but with a minimum of manipulation it’s possible to see that the trite and unfair quote “If You Are Not a Liberal at 25, You Have No Heart. If You Are Not a Conservative at 35 You Have No Brain” – using the American sense of the word “Liberal” anyway – seems reflected in the results. The older age groups are consistently more say they will vote for the Conservatives.
Here I took the Yougov results for the top and bottom age group, but the pattern is common.
On these charts, as is commonly the case, they use the NRS social grade system. Here “A” is the top social class and E is the bottom. Perhaps showing the dated nature of this segmentation, it traditionally depends on the job held by the “head of the household”. High-up managers are class A, casual workers, or unemployed etc. would be class E. Wikipedia informs us that ABC1 is often considered middle class and C2DE is working class (the truly “upper class” do not feature here!).
The charts therefore show that the “middle class” are more likely to say they are voting Conservative than the “working class”.
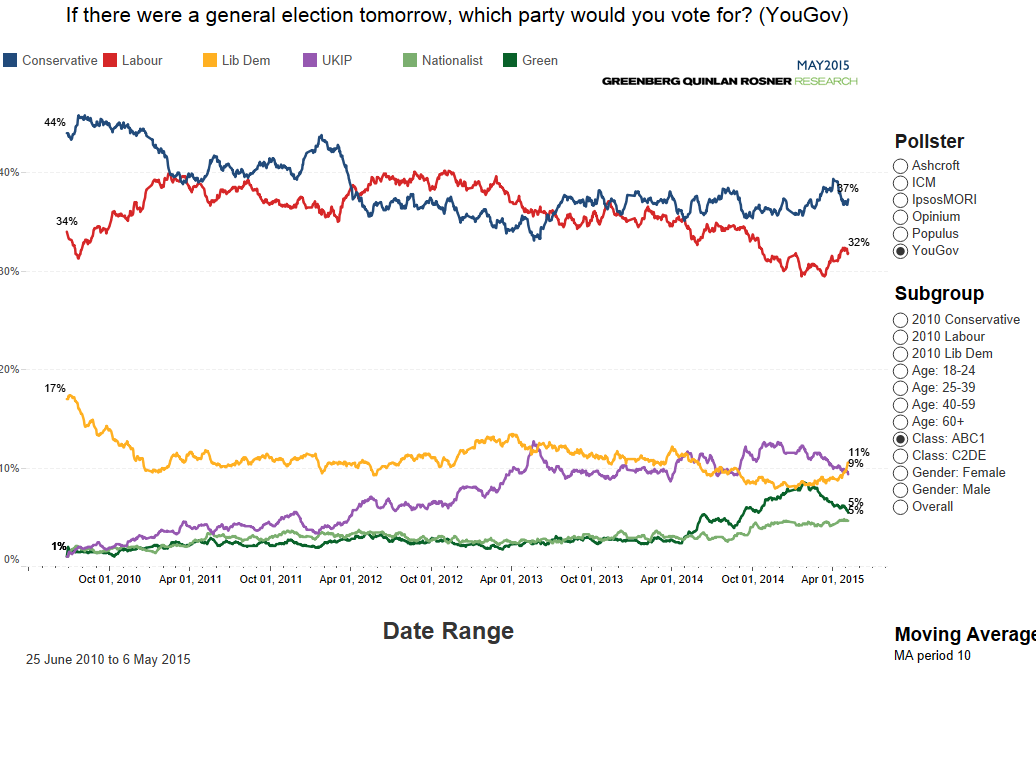
This makes some sense in that many of their policies seem to be designed to keep said wealth (and resulting power) in the hands of the richer, property-owning people – which also tend to be those of older ages.
For example, recent hot topics for the Conservatives include reducing the number of people who pay the higher (40%) income tax rate which affects today around 15% the people, who by definition already have the highest income.
And then raising also the threshold where one pays inheritance tax on an inherited estate to a potential net value of £1 million.
Even at today’s lower threshold, this affects 0% of the people who owned/earned that property (what with them being dead) and around 3-5% of estates which by definition are those that are the most wealth-enhancing for the recipients who fate has chosen to be lucky enough to gift them.
These recipients also tend to be those with the highest incomes already before inheriting too, promoting inequality ever higher .
As anyone with a light grasp of medians can tell, these sort of policies are not about supporting the struggling or even “middle class” parts of society, but rather the top few percent. At first glance it may be somewhat hard for a disbeliever to understand why even 24% of the population, even if they had no thought for others – and it cannot be the case that Conservative voters are as socially heartless as it’s easy for some of the left to assume I’m afraid! – would vote that way when it’s seemingly against the interests of the majority of them.
But there’s more to life, and voting, than the decisions of homo economicus (again, Haidt is good on this subject) – and Steinbeck’s famous quote probably has something to do with it too:
Socialism never took root in America because the poor see themselves not as an exploited proletariat but as temporarily embarrassed millionaires.
Other factors abound in this election. Clearly geographic location matters. Here’s the geo-results as per the BBC: 
Most obviously – almost all Scottish seats returned SNP.
There have also been numerous, often unverifable, maps of “election results vs variable x” doing the rounds lending a mix of potential true insight and crazy correlation abuse to the situation. Here’s a couple of the most common – apologies lack of certainty re source, they spread so far and wide it’s not 100% clear to me where their origin is.
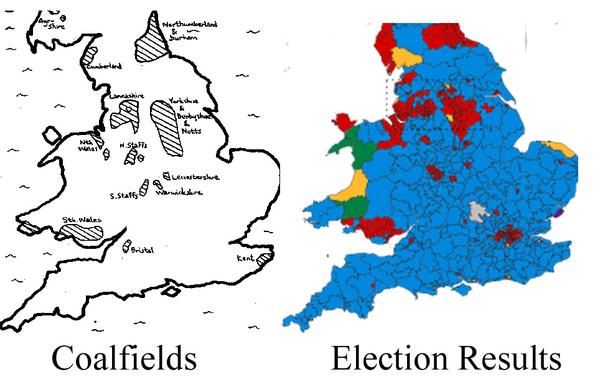
What the above map may imply though is that voting results may often be influenced by historical legacy rather than whichever current policy iteration the respective parties are on.
To this day, there’s a “Boycott the Sun newspaper” campaign in Liverpool following offensive reporting on the 1989 Hillsborough football disaster. People have long hard memories, even for events that they are too young to have personally experienced. It’s not out of the bounds of reasonability that some voters in ex-mining areas remain resentful at what is often seen as Thatcher’s attack on coal mining communities, some of which still suffer the resulting substantial deprivation and associated problems even today.
This is of course just one of very many historical events that might influence people’s thoughts on particular parties even before they release the latest greatest thrilling 100-page manifesto de le jour.
The below map clearly provides far more answers, for which no further explanation is necessary.
That’s easy to answer simplistically. The constant polling leading up to the day by various professional polling instiutions consistently predicted a hung Parliament, with Conservatives and Labour having a pretty equal share. One day one might be 1% up, the next 2% lower, but it seemed clear that overall it was a pretty even match.
The New Statesman spun off a May2015 site that kept everyone up to date with the “poll-of-polls”, aggregating sometimes daily polls provided by 9 credible sources. Here’s how it looked throughout 2015, noting how close the red (Labour) and blue (Conservative) line consistently were towards the end. 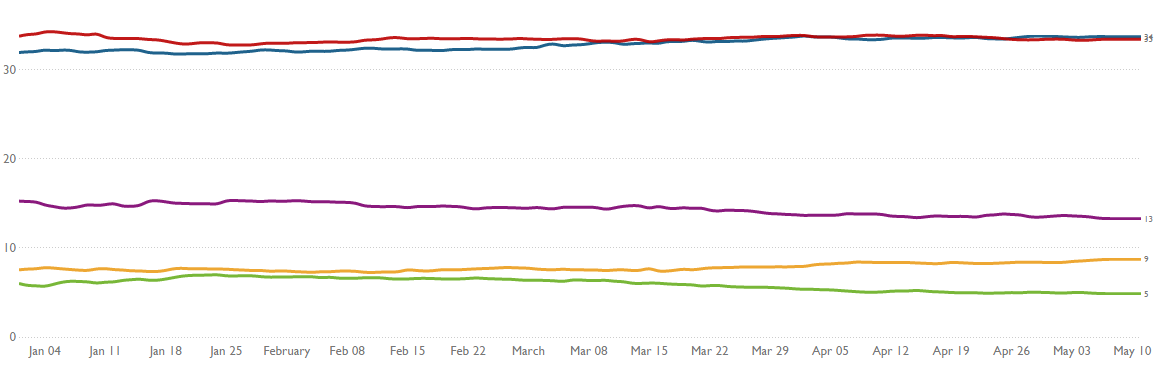
However, to reflect the balance of seats, and therefore the reality of who wins, we already established we can’t just multiple up the %s into seats. Polling agencies therefore use various clever models to do this. Here’s the seat-based prediction of the final Yougov poll of May 6th.

It has the Conservatives ahead of Labour, but only by 21 seats. As the UK Parliament has 650 seats, a single party has to achieve 326 seats to have a majority government. This poll, like pretty much every other pre-election poll recently, suggests that there will be no majority government.
Just after the voting finished, an exit poll was released. This is the BBC’s chart of it:

People’s mouths gaped with astonishment as it seemed that the exit poll was projecting a far higher Conservative number of seats and a lower Labour one that most every other poll so far. Could it really be correct? Surely not. Paddy Ashdown, who has seen a few elections in his time, was so outraged he said he’d eat his hat if it was true.
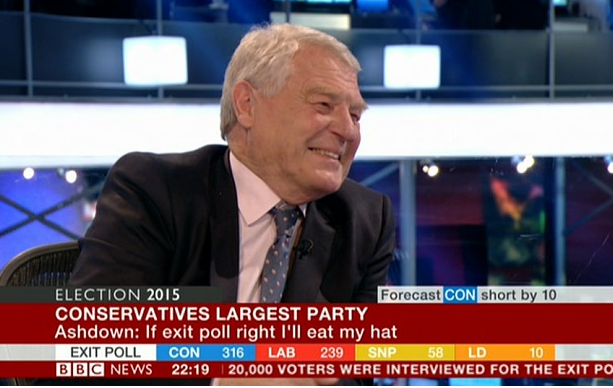
Not to preempt the results – but it turns out that he had to go ahead and fulfill that promise in front of the national media, as the Telegraph documents.
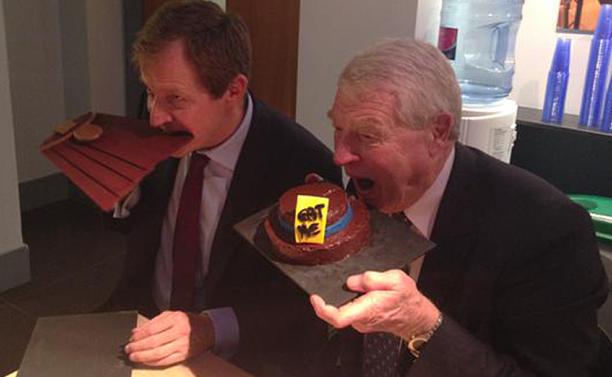
(Yes, that does seem to be a chocolate hat. I guess it must have been in the small print). So the exit poll was correct? Well, no, not really. It was far closer than nigh on all other polls, but it still understated the eventual victory. Here’s the results for the big 2 parties.
| Party | Final Yougov poll | Exit poll | Reality |
|---|---|---|---|
| Conservative | 284 | 316 | 331 |
| Labour | 263 | 239 | 232 |
| Difference | 21 | 77 | 99 |
The exit poll was therefore still understating the Conservative victory (and sadly near the border of majority, so it still predicted a hung Parliament vs the actual outcome of a Conservative majority). But it remained nonetheless far more accurate than pre-election polls. Yougov is just an example that was easy to find – in reality, the major published polls were all very close to each other.
So why would this be? It’s still very early days, and much hand-wringing in the polling industry is going on looking at what may have caused this and how it could be improved next time. But cobbled together from various early media reports, a few potential factors seem to have sprung to light.
- It could be down to turnout. The Exit poll is polling only those people coming out of a polling station after they have voted. Therefore they definitely have voted. Whereas during a phone/internet interview some people may express that they will certainly vote when in reality they do not do so for whatever reason. Ipsos Mori are (perhaps controversially) claiming a “lazy Labour” phenomen, where those who said they intended to vote Labour didn’t.Turnout decline should be built into the polling models, but Ipsos say it was more extreme than normal with 16% of people who said they were certain to vote in reality not doing so, vs the normal of 10%.
- It could be due to people changing their minds between being polled and voting. However considering some of the polls were taken very soon before, or even potentially after, the person would have voted this seems less likely, in addition to no-one detecting any massive event that would sway previously decided opinions.
- It could be the “shy Tories” phenomena. This is the theory popularised over recent history that people who intend to vote Conservative are – for whatever reason – less likely to admit to doing so in a poll – whether they just answer “will not disclose” or indeed make up a false answer. However this adjustment factor tends to be built into modern polling approaches, so either the Tories were shyer than usual or it isn’t the whole explanation. (It does also seem strange to me that one would vote for something they were ashamed of – but it does seem to be held by most to be a fact.)But wouldn’t they be equally as shy in the exit poll? Not necessarily, as these exit polls are generally taken in the same way as the real vote. The respondents are handed a fake voting card to fill in and it’s put in a fake ballot box, giving a sense of guaranteed anonymity. There’s no interview with a person, a machine, or anything else that you might think would judge or transmit your response onward. There are many psych-type studies available on the subject of how even the most virtuous person’s behaviour changes when they feel they’re anonymous vs being somehow watched – plus replicating something you have just actually done for real is likely, all other things being equal – to be much easier than imagining what you will probably do in the future.
- It could be down to the method of polling. More and more polls are taken wholly or in part via the internet or automated telephone calling, often for cost reasons. Survation claim that their telephone-only (mobiles and landlines no less) poll the day before the election produced far more accurate results, and they now regard phone polling as the “gold standard” for this type of poll.
- It could be due to polls being reluctant to release or even fudging the figures to meet the common consensus of their peers. The above-mentioned Survation poll never had its results published because it seemed “so out of line” with other polls that they dare not publish immediately. This can obviously lead to a group consensus mode of thinking where it’s hard for true shifts in outcome to get widely publicised.
- It could be down to the specific questions asked. Nate Silver’s FiveThirtyEight team have suggested that had they chosen to take the general question “If there was a general election tomorrow, which party would you vote for?” in their poll consolidation model instead of the more specific question “Thinking specifically about your own parliamentary constituency at the next general election and the candidates who are likely to stand for election to Westminster there, which party’s candidate do you think you will vote for in your own constituency?” then their results would have been more accurate (but still not entirely correct).Labour’s internal polling people apparently repeatedly got a more realistic (worse for them) outcome in their work by re-ordering the questions to try and minimise the number of people who respond with “don’t know” when asked how they’d vote – “we first ask respondents to think about the country, the economy, their top issues, the parties and the leaders. We think it gets them closer to their ballot box mindset.”
- It could be down to the extra modelling data available around an exit poll which may add accuracy. David Firth from the Warwick Department of Statistics writes about many of the variables. But some to note include that an exit poll sample, whilst small compared to the number of real voters, is much bigger than some of the pre-election poll size, and they are designed in a way that is somewhat longitudinal allowing the use of known results from each particular polling station in past elections and their relationship to the outcome to be used.
Have people switched political allegiance? Did the UK shift to the political right-wing?
Undoubtedly some people voted for a different party than they did in a previous election – but with all the above factors included, possibly fewer than it would seem at first sight.
Ignoring for a moment the issues surrounding polling (!) the Mirror’s Ampp3d writers did their best to produce a chart of vote changes since 2010.
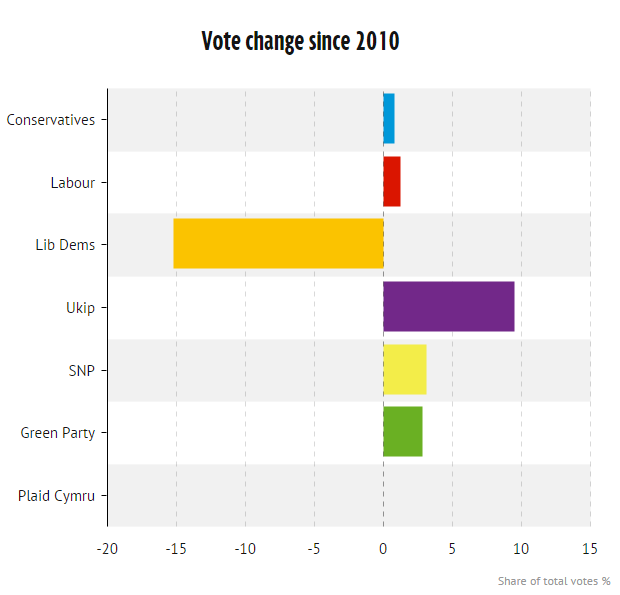
Some unintuitive facts jump out immediately – both the Conservatives and Labour increased their share of the total popular vote since last year; in fact Labour increased it slightly more. As the Mirror correctly noted: “One of the great quirks of our election system that very slight changes in vote share, lead to big differences in seat share“.
UKIP saw a huge increase (admittedly from a low 2010 base), and the Libdems saw the anticipated – actually much worse than anticipated by some! – mega drop. SNP votes, despite radically changing the seat winners throughout Scotland, did not rise by a huge percentage – not least because only people living in Scotland had a chance to vote for them.
The Greens also made some gains despite being politically very much in the opposite direction of the winning Conservatives and the biggest-gainers UKIP.
Jim Pickard went a step further in tweeting a picture showing the shifts to and from each party.
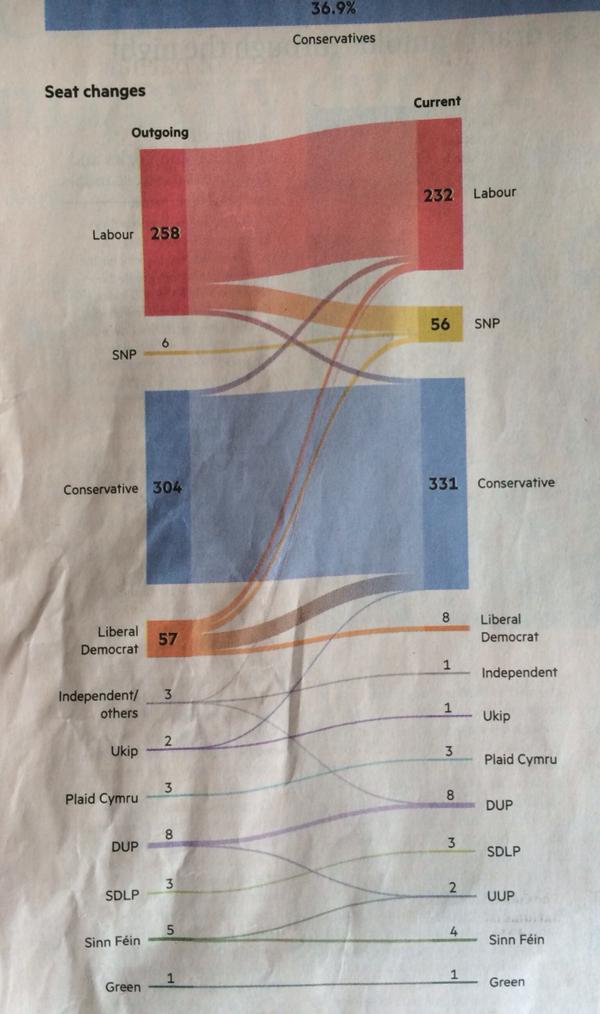
The diagram makes it clear that, even in terms of seats rather than votes – data which is fact rather than polled – a mass defection from, for example, Labour to Conservative did not happen. Labour did lose a fair chunk to SNP (representing almost all their Scottish seats), but not so many to the Conservatives, who also lost a few back to Labour.
The Conservatives did pick up a fair few seats however from the Lib Dems. This might seem a little strange as, although traditionally considered a more centrist party, they seemed to have some appeal as a leftist protest vote in 2010.
Yougov tracks the left/right perception of the main political parties over time, and one can see that indeed the the respondents tended to consider Lib Dems somewhat more left than right back at the time of the previous election.
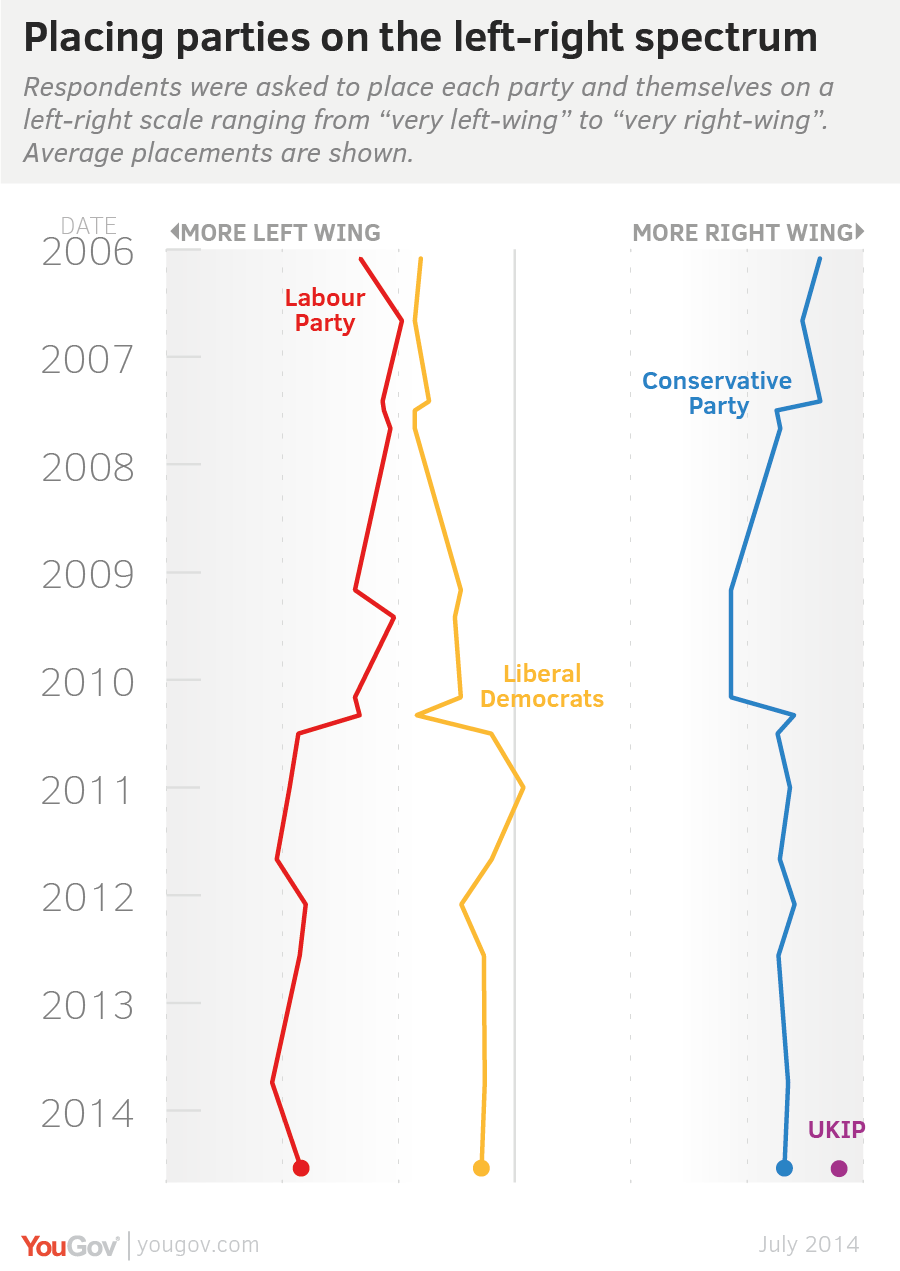
However, in reality, many of the Lib Dem ex-supporters who were disappointed (to put it politely) with their performance as part of the last Government’s coalition, were clearly tempted right towards the Conservatives rather than the alternative more left parties in many cases.
The Liberal Democrat seat holdings were therefore largely eradicated. But in case anyone has forgotten the legends, here’s the ultra-cringeworthy Nick Clegg apology video where he says sorry for promising to vote against tuition fee increases shortly before supporting increasing them by thousands of pounds.
It’s nice to get an apology, even brave of him perhaps – but it didn’t seem to persuade many of the voters to stay loyal (but possibly made Youtube richer due to the many musical remixes of this speech we were treated to).
Even with that though, taking it back from seat countto the popular vote, it does not seem that there’s been a shift right by any huge degree. Simon Hix tweeted a summary of which parties are deemed to be on the left vs right of the political spectrum and how far the aggregate vote changed from 2010 to 2015 went.
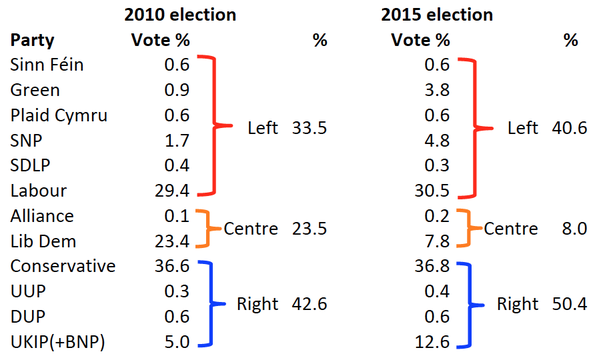
With this grouping, the increase in left-wing vote share from 2010 to 2015 is 7.1pp vs an increase of 7.8pp on the right-wing. Potentially therefore a gain on the right but, even if significant, it’s much smaller than the Labour vs Conservative seat shift suggests when taken out of context.
Although these are aggregate figures, once could read it as people turning to more polarising parties – something that is almost inevitable if there was to be a mass fleeing from the Lib Dems as there is not another major party considered centrist in most of the UK.
Were the results a terrible conspiracy?
Christopher Everard, who has apparently produced many intriguing films, many about the Illuminati, some collaborations with David Icke and other “non-mainstream thinkers” thinks so! In a Facebook post he claims:
HOW THE SCAM WORKED: Voters in Bournemouth were casting votes on the wrong ballot papers – or being told to ‘come back later’. All nine polling stations in Kinson North and Kinson South were affected by a printing error on books of ballot papers. Meanwhile, in Hastings, 200,000 ballot papers were stolen – divided up, these would have been enough to swing at least 30 marginal seats. Hundreds of postal ballot papers were sent out without the names of the Green and Labour Party candidates in the Hull East constituency. The provision of pencils in polling booths is a requirement of section 206 of the Electoral Act. There is, however nothing to prevent an elector from marking his or her ballot paper with a pen – but voters were never told this – so everyone used the pencils – and that made it easier to ‘adjust’ the vote. Then two ballot boxes were misplaced by election staff from an Eastwood Hilltop ballot station, as candidates noticed the total number of votes in Labour Leader Milan Radulovic’s battleground was over ‘2,000 crosses too low’. And then Darlington Borough Council faced calls for a re-count after UKIP’s David Hodgson’s name was left off ballot papers. Funny how all these ‘blunders’ never disadvantaged the queen’s cousin, Mr David Cameron
(Advert for his forthcoming documentary removed in the above quote, because I wouldn’t want to be cynical here! But follow the link to Facebook if you have a strong interest).
Whilst some might think Everard’s view a little on the extreme, it’s certain true some mistakes were made. Some people report being effectively disenfranchised due to postal votes not arriving, being turned away from polling stations, with even some accusations of fraud or intimidation. 20 years ago Nick Davies wrote about a dodgy scam apparently being conducted by some party representatives, telling stories of occasions where “somebody appears to have been stealing votes, usually for the benefit of the Conservative Party” – the scam being based on a party supporter tricking/confusing a voter into giving someone else the right to vote on their behalf via a proxy vote.
But in reality, Occam’s Razor would suggest that – although the above sort of detailed, intricate fraud has possibly occurred in some places at some times, and it is a despicable abuse of a fundamental citizen’s right under democracy that should be punished appropriately if indeed it is found to be the case – it’s probably not on the sort of scale that could fully select a Government on conspiratorial factors alone.
The more likely “conspiracy”, perhaps for want of a better word, is perhaps the blanket media coverage by most of the UK’s national papers that suggested, or even pleaded, with their readers that they must vote Conservative to save the country – or at least not for Labour who would ruin the country. “Plead” isn’t hyperbole here. Here’s the Daily Mail front page on the day before the election took place.
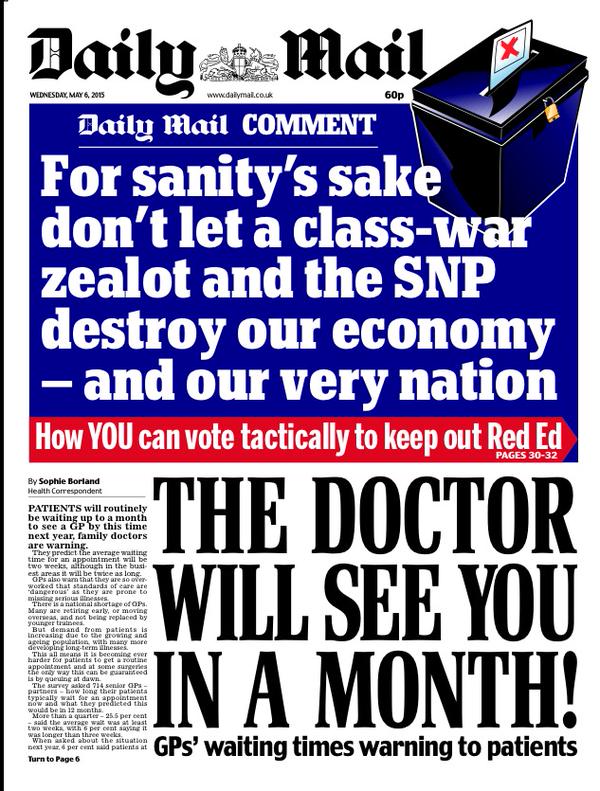
To prevent what the Mail termed the destruction of “our very nation”, the Telegraph went, if anything, a step further.
It directly emailed everyone on its marketing mailing list full of warnings of impending doom should Labour win, ending with the no-shame plea that “The Daily Telegraph urges its readers to vote Conservative.”
Labour has its supporting papers too of course. The Guardian and the Mirror are the notable ones – but I could find far fewer dramatic “end of world” type pleas, and there are have a much lower reach than the right-wing papers.
Below is a chart of the most circulated papers consolidated from the Wikipedia article on UK newspaper circulation and that which lists some details of the newspaper’s viewpoint. Classifying viewpoints is somewhat debatable and subjective – but in general the split is generally quite clear in people’s mind. Chart shows the January 2014 circulation of each newspaper, colour coded as to whether the paper could be thought of as leaning to the political right (blue), left (red) or neutral (grey).  Totalling up the circulation figures we could approximate that the circulation of the main newspapers by viewpoint in the UK is roughly:
- Rightwing: 77%
- Neutral: 3%
- Leftwing: 21%
The Conservative party is to the right of the Labour party, and therefore – as you can see illustrated in the examples from the Mail and Telegraph above – extra circulation of right wing press will tend to very much favour (or plead!) for Conservative votes.
And why would newspapers tend to be rightwing Conservative supporters? Well, those of a cynical (sane?) viewpoint might note that most of them are owned by rich proprietors, whose financial interests are presently generally more in line with Conservative than Labour policies.
Rupert Murdoch for instance owns both the Sun and the Times (plus the Sunday Times), a collection with relatively huge circulation. It’s been reported that, feeling under threat of a forced company breakup due to levels of media monopolisation if Labour won, he personally took a meeting with the editor of the #1 circulated paper in February of this election year and told him that “he expected the paper to be much sharper in its attacks on Labour”.
Two days later an article appeared with a photo of the Labour chancellor, Ed Balls, with the slightly inflammatory headline “I ruined your pensions, I sold off our gold, I helped wreck [the] economy, Now I’m going to put up your taxes.”.
These are probably not popular policies with the average Sun reader, or indeed anyone. They are also [probably] not what Mr Balls’ message to the electorate actually was. But, being slightly catchier than the 86 page Labour manifesto – this “threat to the country” would be the message left in the heads of the >1 million daily readers as they consider who to vote for.

Afraid I don’t share your belief that Tory voters aren’t socially heartless.
Given what is currently going on in this country and the suffering, hardship and deaths amongst the poorest and most vulnerable people in society, I fail to see how anyone voting Tory can be anything else.
LikeLike