Whilst Tableau has an increasing number of advanced statistical functions – a case in point being the newish analytics pane from Tableau version 9 – it is not usually the easiest tool to use to calculate any semi-sophisticated function that hasn’t yet been included.
Various clever people have tried to work some magic aroud this, for instance by attempting “native” Z-testing. But in general, it’s sometimes a lot of workaroundy effort for little gain. However, a masterstroke of last year’s Tableau version was that is included the ability to interface with R.
R is a statistical programming language that really does have every statistical or modelling function you’ll ever need. When someone invents new ones in the future, I have no doubt an R implementation will be forthcoming. It’s flexibility and comprehensiveness (and price…£0) is incredible. However it is not easy to use for the average person. For a start, the default interface is a command line, and – believe it or not – there are people alive today who never had the singular joy of the command line being the only way to use a computer.
It must be said that in some ways Tableau has not really made R super easy to use. You still need to know the R language in order to use R functionality inside Tableau. But using the Tableau interface into R has 2 huge benefits.
- It integrates into your exist Tableau workspace. The Tableau interface will push any data you have in Tableau, with all your filters, calculations, parameters and so on to R and wait for a result. There’s no need to export several files with different filters etc. and read.csv(“myfile1.csv”) them all into R. Once you’ve set up the R script, it reruns automatically whenever your data changes in Tableau.
- It visualises the results of the R function immediately and dynamically, just like any other Tableau viz. R has a lot of cool advanced graphics stuff but it can be hard to remember quite how to use and the most of the basic components offer no interactivity. No drag and drop pills or “show me” to be seen there!
So recently when I needed to perform a Kruskal Wallis significance test over data I was already analysing in Tableau, this seemed the obvious way to do it.
Kruskal Wallis is fully explained in Wikipedia .To over-simplify for now, it allows you to detect whether there is a difference in data when it comes from multiple groups – like ANOVA more famously does, but KW doesn’t require data to be parametric.
This is classic hypothesis testing. With my questionnaire, we start with the hypothesis that there is no difference in the way that different groups answer the same question, and see if we can disprove that.
In honesty, the fact it’s a KW test is not all that important to this post. Using R to perform a certain test in Tableau is pretty much the same as it would be for any other test, aside from needing to know the name and syntax of the test in R. And Google will never let you down on that front.
In this case, I wanted to analyse questionnaire results scored on a Likert-type scale to determine on several dimensions whether the answering patterns were significantly different or not. For instance, is there a real difference in how question 1 is answered based on the respondents age? Is there a real difference in how question 2 is answered based on respondents country of origin? How confident can we be that any difference in averages truly represents a real difference and is not the results of random noise?
I wanted to do this for about 30 questions over 5 different dimensions; a total of 150 Krusal-Wallis tests, and I didn’t overly fancy doing it manually.
Had I got only a copy of pure R to hand, this might be how I would have tackled the question – assuming that I output the results of question 1 dimensioned by groups in a CSV file before, in a format like this:
| RespondentID | Group | Score |
|---|---|---|
| R1 | Group A | 4 |
| R2 | Group B | 5 |
| R3 | Group B | 5 |
| R4 | Group A | 3 |
| R5 | Group C | 1 |
setwd('../desktop/questionnaire')

q1_data<-read.csv('q1_responses.csv')

q1_dataframe<-setNames(data.frame(q1_data[3], q1_data[2]), c('scores','groups'))

kruskal.test(scores ~ groups, data=q1_dataframe)
This would give me output like the below.
Kruskal-Wallis rank sum test

data: scores by groups

Kruskal-Wallis chi-squared = 2.8674, df = 2, p-value = 0.2384
To understand the syntax and what it returns, see the man page for kruskal.test here.
But to pick a singular point, it shows case shows that the “p-value”, the probability of the differences in scores between the groups being purely down to the random fluctuations of chance, is 0.2384, aka 24%. Numbers above 5-10% are often held to mean that any difference seen has not been statistically proven. Here there’s about a 1 in 4 chance that any differences in these answers are purely due to random chance.
There are endless discussions/controversies as to the use of P values, and statistical vs “clinical” differences – but this is the end point we are aiming for right now.
I could then have done the above process for the other 149 combinations I wanted to test and constructed a table of P results (or scripted to do the same), but it seemed more fun to use Tableau.
First you have to set up Tableau to interface with R correctly. This means running an R-server (called Rserve, handily enough) which is of course also free, and can be started from within the R interface if you have it open. Here’s Tableau’s handy instructions but it can be boiled down to:
install.packages("Rserve")

library(Rserve)

Rserve()
A few notes:
- It’s fine to run the Rserve on the same computer as Tableau is on.
- You only have to enter the first line the first time you use Rserve.
- Capitalisation of Rserve matters for some commands!
- If you are going to use Rserve a lot more than you use R you can start it from an exe file instead, as detailed in the above Tableau article.
- Workbooks using R will not work in Tableau Reader or Tableau Online.
Then carry on the process of setting up R as per the Tableau article. Notably you have to look in the Help menu (a strange place for it perhaps) for “Settings and performance” then “Manage R connection” and then type in the name of your Rserve host. If you’re running it on your computer then choose “localhost” with no user/password.

Next, assuming you have your Tableau workbook already set up with your questionnaire data, create a new worksheet which filters to show only a single question, and has each unique person that answered that question and the grouping variable on the rows. This layout is important, as will be discussed later.

Now it’s time to write the formula that interfaces between Tableau and R.
This Tableau blog post explains in detail how to do that in general – but the essence is to use a calculated field with one of the Tableau SCRIPT_ functions that corresponds to the type of result (string, integer etc.) that you want to retrieve from R. You then pass it literal R code and then use placeholder variables .arg1, .arg2…argN to tell it which data you want Tableau to send to R.
The calculated field will then send the R script with the relevant data inserted as a R vector into the placeholders to the R server, and wait for a result to be returned. The result can then be used inside Tableau as, just as any other table calculation can .
For the Kruskal Wallis test, when we retrieve the P value from a KW test, we saw above that it is in a decimal number format. This is what Tableau calls a “real” number, so we use the SCRIPT_REAL function.
Within that function we enter R code resembling the last line in my R-only attempt, which was the one that actually did the calculations.
You can put more than one R code line in here if you want to. However note that a Tableau R function can only handle returning a single value or vector by default. Here I have therefore specifically asked it to return just the p value as it would be hard to handle the general table of results and associated text. Read the R documentation for any function to understand which other types of value are possible to return from that function.
So, in Tableau, here’s the calculated field to create.
Kruskal Wallis p score:
SCRIPT_REAL(

"

kruskal.test(.arg1~.arg2, data=data.frame(.arg1,.arg2 ))$p.value

",

AVG([Score]),ATTR([Group]))
If you compare it to my first R script, you can see that I want it to replace “.arg1” with the first argument I gave after the R script (AVG([SCORE]) and “.arg2” with the GROUP. It’s safe, and necessary, to use ATTR() as you have to pass it an aggregation. Because we set the layout to by 1 row per respondent we know each row will have only a single group associated with that respondent (assuming the relationship between respondents and groups is 1:many, which it needs to be for a successful KW test).
You could use .arg3, arg4… etc. if you needed to pass more data to R, but that’s not necessary for the Kruskal Wallis test.
You can then double click your new calculated field and it’ll appear in the text pill and display the p value we saw above (remember, that 0.2384 number from above? Horray, it matches!) repeatedly, once per respondent. The nature of the KW test is that it returns one value that describes the whole population.

Being Tableau we can filter to show another single (see below) question, change the respondent pool, highlight, exclude and do all sorts of other things to the data and the new P value for the given breakdown is immediately shown (subject to the rules of table calculations…remember that SCRIPT_… Functions are table calculations!)
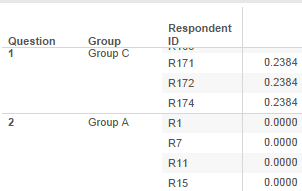
But what if we want the Kruskal P value for all the questions in the survey in one table, and not have to iterate manually through every question?
We can’t just unfilter or add questions willy-nilly, because a single p value will be calculated for the whole dataset of ( question 1 + question 2 ) responses, instead of one being calculated for ( question 1) and another for ( question 2 ). This is unlikely to be useful.

See how there’s no 0.2384 value in the above. Instead the same number is repeated for every single question and respondent. It’s compares the scores as though they were all for the same question.
By virtue of the SCRIPT_ Tableau functions being a table calculation though, this one is relatively easy to solve.
Right clicking on the R calculation field gives the normal Edit Table Calculation option. Pick that, and then select “Advanced” under Compute Using.
Simplistically, we want to partition the P values that are calculated and returned to 1 per survey question, so put “Question” in the partition box and the other fields into the addressing box.

Hit OK, Tableau refreshes its R stuff, and all is good. That 0.2384 is back (and the 0 for question two is the result of rounding a number so small that the p value shows significance at all practical levels.)
However, we’re getting 1 row for every respondent to every question instead of a nice summary of one row per question.
We can’t just remove the respondent ID from the Tableau view because, whilst this gives the layout we want, the SCRIPT_REAL calculation will pass only the aggregated values of the respondent data to R, i.e. one average value per question in this case, not 1 per person answering the question.
This will give either an error or a wrong answer, depending on which R function you’re trying to call. In this case it would be passing the average response to the question to R to perform the KW test on, whereas R needs each individual response to the question to provide its answers.
The solution to this issue is the same as the classic trick they teach in Tableau Jedi school that allows data to be dynamically hidden yet remain within scope of a table calculation. Namely that when you use a table calculation as a filter, the calculations are mostly done before a filter is applied, in contrast to a non-table calculation where the calculations are done on the post-filtered data.
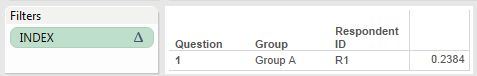
So, create a simple dummy table calculation that returns something unique for the first row. For instance, create a calculated field just called “Index” that has the following innocuous function in it.
INDEX()
Now if you put that on filters and set it to only show result “1” (the first result) you will indeed get 1 result shown – and the 0.2384 P value remains correct.
But we actually wanted the first result per question, right, not just the single first result?
Luckily our index function is also a table calculation, so you can do exactly the same compute-by operation we did about to our R-based field.
Right click the index filter pill, go back to “Edit table calculation”, and fill the Compute Using -> Advanced box in in the same way as we previously did to our R calculation function, putting “Question” into the partition box and the rest into addressing.
Tada!

In the interests of neatness we can hide the useless respondent ID and group columns as they don’t tell us anything useful. Right click the respective Rows pill and click ‘Show header” to turn the display off, whilst leaving it in the pills section and hence level of detail.

Bonus tips:
- You can send the values of Tableau parameters through the R function, controlling either the function itself or the data it sends to R – so for instance allowing a novice user to change the questions scored or the groups they want to compare without having to mess with any calculated fields or filters.
- The R-enabled calculation can be treated as any other table calculation is in Tableau – so you can use it in other fields, modify it and so on. In this example, you could create a field that highlights questions where the test showed that the differences were significant with at 95% certainty like this.
Highlight 95% significance:
IF [Kruskal Wallis test p value] <= 0.05 THEN "Significant" ELSE "Not significant" END
Pop it on the colours card and you get:

Now it’s easy to see that, according to Kruskal-Wallis, there was a definite difference in the way that people answered question 2 depending on which group they were in, whereas at this stringent level, there was no proven difference in how they answered question 1.
You can download the complete workbook here.

this was a super helpful analysis! I’m looking to replicate something similar with my survey data that contains a control & test group. However, i’m dealing with proportions (%) vs. record count (#). So for example, i’m looking at the control group vs. test group and determining whether there’s a difference between how the two groups rated a certain brand.
Is there a way i could send a few screenshots to get your advice on how to approach this?
LikeLike
Hi there,
Thanks for the comment. I’m glad this was useful!
In order to deal with proportions, I think the main difference was that you would use a different hypothesis test. There are several options, but a common one in R I think would be the prop.test function.
There’s some information as to how to use that on this page: http://www.sthda.com/english/wiki/two-proportions-z-test-in-r
Another option might be a chi squared test, which is the chisq.test() function as described at http://www.sthda.com/english/wiki/chi-square-test-of-independence-in-r
Unfortunately I don’t have Tableau installed on my current computer, so I can’t test it out as such. But I think the main difference if you wanted to use it instead Tableau would be in the step above that showed:
SCRIPT_REAL(
”
kruskal.test(.arg1~.arg2, data=data.frame(.arg1,.arg2 ))$p.value
“,
AVG([Score]),ATTR([Group]))
Instead of the kruskal.test function there, you could perhaps use the prop.test or chisq.test function.
Hope that helps!
LikeLike
Hi, I am in the process of implementing a similar test. I can run an overall test similar to what you have walked us through. Have you had an opportunity to run pairwise tests for a posthoc analysis? I am trying to see how to implement this using R once the overall test is significant.
LikeLike
Hi! Thanks for your comment. And sorry for the delayed reply.
I’m afraid I don’t have Tableau installed any more so I can’t test what works in Tableau, but if you are happy using R outside of Tableau (or don’t mind experimenting with the integration to Tableau!), then a common post-hoc test for Kruskall Wallis seems to be the Dunn test.
It’s implemented in the R package “FSA” at https://cran.r-project.org/web/packages/FSA/index.html
In R you could do something like:
library(FSA)
dunnTest(my_outcome ~ my_group, data = my_data, method = “bonferroni”)
(replacing my_outcome, my_group and my_data with your actual variables in R, and the method if you prefer a different adjustment method).
LikeLike