Tableau maps can understand many geographic features, but, somewhat surprisingly, whole continents is not one of them. It’s a requested feature but hasn’t yet made the grade to be included.
However, it was pretty easy to find several shapefiles of continents freely available online. Here’s one.
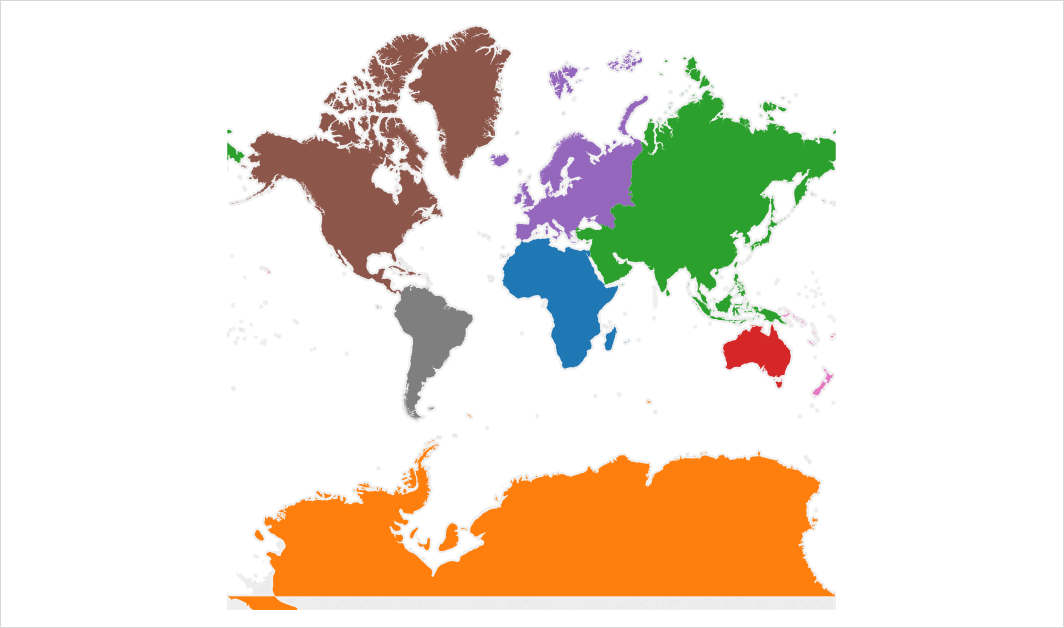
Tableau can’t read shapefiles (yet). But, inspired by tableaumapping.bi, I then used this technique to convert it into a Tableau file with the relevant data to produce a polygon “chart” that appears as continents, like the below illustration shows. Click through to see it live on Tableau Online.
If you’d like to incorporate this mapping data in your own analysis, feel free to download the TDE file from here.
Load it into your Tableau Desktop, and set up your marks shelf like this:

Then double-click the longitude and latitude fields so they end up on the Columns and Rows shelf respectively, and off you go. Far better (video) instructions on how to do that are available at tableaumapping.bi, if that was less than clear.
It should be noted that this “workaround” somewhat abuses the polygon chart feature so does not behave in the same way as the geographies Tableau natively knows (or can be added to with Mapbox et al.) – but it does nicely as a quick and dirty solution.
