Somewhere in my outrageously long list of data-related links to check out I found “data.world“. Not only is that a nice URL, it also contains a worthy service that I can imagine being genuinely useful in future, if it takes off like it should. At first glance, it’s a platform for hosting data – seemingly biased towards the “open” variant of data although I see they also offer to host private data too – with some social bits and pieces overlaid.
What’s interesting about this particular portal to me over and above a bunch of other sites with a mass of open data available on them is:
- Anyone can upload any conventional dataset (well, that they are legally allowed to do) – so right now it contains anything from World Bank GDP info through to a list of medieval battles, and much more besides. Therefore it presumably seeks to be a host for all the world’s useful data, rather than that of a certain topic or producer. Caveat user etc. presumably applies, but the vision is nice.
- You can actually do things with the data on the site itself. For example, you can join one set of data to another hosted on the site, even if it’s from a totally different project from a totally different author, directly on the site. You can run queries or see simple visualisations.
- It’s very easy to get the data out, and hence use it in other tools should you want to do more complicated stuff later on.
- It’ll also host data documentation and sample queries (for example, SQL that you can run live) to provide contextual information and shortcuts for analysts who need to use data that they might not be intimately familiar with.
- There’s a social side. It also allows chat conversations between authors, users and collaborators. You can see what’s already been asked or answered about each dataset. You can “follow” individual people, or curated collection of subject-based datasets.
So let’s test a few features out with a simple example.
The overriding concept is that of a dataset. A dataset is more than a table; it can include many tables and a bunch of other sorts of non-data files that aid with the use of the data itself – for instance documentation, notebooks or images. Each user can create datasets, name and describe them appropriately, and decide whether they should be public or private.
Here’s one I prepared earlier (with a month of my Fitbit step count data in as it happens).

You can make your dataset open or private, attribute a license to be explicit about its re-use, and add tags to aid discovery. You can even add data via a URL, and later refresh if the contents of that URL changes.
As you can see, after import it shows a preview of the data it read in at the bottom of the screen. If there were multiple files, you’d be able to filter or sort them to find the one you want.
If you hit the little “i” icon next to any field name, you get a quick summary visualisation and data description, dependent on data type. This is very useful to get a quick overview of what your field contains, and if it was read in correctly. In my view, this sort of thing should be a standard feature in most analytical tools (it already is in some).

I believe tags, field names and descriptions are searchable – so if you do a nice job with those then it’ll help people find what you’re sharing.
Other common actions now available after you’ve uploaded or discovered a data table of interest would be to:
- download the data (as a CSV),
- copy a URL which links to the data (which looks something like https://query.data.world/s/1q11dqcw442nj10g1u0jzpolj )
- get a connect string for Python or R, which looks like “df <- read.csv(“https://query.data.world/s/1q11dqcw442nj10g1u0jzpolj”,header=T);” – meaning you can just paste that into a script and there you go, dataframe made.
You can also “explore” the data. This expands the data table to take up most of the screen, enabling easier sorting, filtering and so on. More interestingly, you can open a chart view where you can make basic charts to understand your data in more detail.
Now, this isn’t going to replace your dedicated visualisation tool – it has only the most basic of customisations available at the moment – but it handles simple exploration requirements in a way that is substantially less time consuming than downloading and importing your data into another tool.
It even suggests some charts you might like to make, allowing 1-click creation. On my data, for example, it offered to make me a chart of “Count of records by Date” or “Count of records by Steps”. It seems to take note of the data types, for instance defaulting to a line chart for the count by date, and a histogram for the count by steps.
Here’s the sort of output the 1-click option gives you:
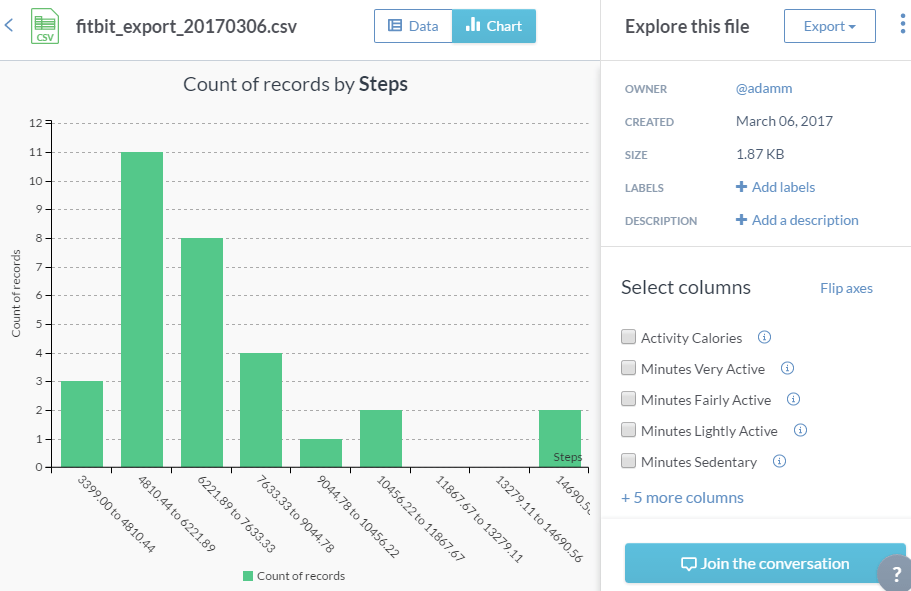
OK, that’s not a chart you’re going to send to Nature right away, but it does quickly show the range of my data, let me see check for impossible outliers, and gives some quick insights into the distribution. Apparently I commonly do between about 5000 and 7500 steps…and I don’t make the default Fitbit 10k steps target very often. Oops.
These charts can then immediately be downloaded or shared as png or pdf, with automatically generated URLs like https://data.world/api/chart/export/d601307c3e790e5d05aa17773f81bd6446cdd148941b89b243d9b78c866ccc3b.png
Here I would quite like a 1-click feature to save & publish any chart that was particularly interesting with the dataset itself -but I understand why that’s probably not a priority unless the charting aspect becomes more of a dedicated visualisation feature rather than a quick explore mechanic.
For now, you could always export the graphic and include it as, for example, an image file in the dataset. Here for example is a dataset where the author has taken the time to provide a great description with some findings and related charts to the set of tables they uploaded.
One type of artefact you can save online with the dataset are queries. Yes, you can query your file live onsite, with either (a variant of) SQL or SPARQL. Most people are probably more familiar with SQL, so let’s start there.
Starting a new query will give you a basic SELECT * LIMIT query, but you’re free to use many (but not all) standard SQL features to change up your dataset into a view that’s useful to you.
Let’s see, did I ever make my 10k step goal in December? If so, on which days?

Apparently I did, on a whopping four days, the dates of which are outlined above. I guess I had a busy Christmas eve.
These results then behave just like a data table, so they can then be exported, linked to or visualised as a chart.
Once you’re happy with your query, if you think it’s useful for the future you can save it, or if it might aid other people, then you can publish it. A published query remains with the dataset, so next time someone comes to look at the dataset, they’ll see a list of the queries saved which they can re-use or adapt for their own needs. No more need for hundreds of people to transform a common dataset in exactly the same way again and again!
Interestingly, you can directly query between different datasets in the same query, irrespective of data table, data set, or author. Specifying the schemas feels a little fiddly at the moment, but it’s perfectly doable once you understand the system (although there’s no doubt room for future UI improvement here).
Imagine for instance that, for no conceivable reason, I was curious as to which celebrities sadly died on the days I met my 10k steps goal. Using a combination of my dataset and the 2016 celebrity deaths list from popculture, I can query like this:

…only to learn the sad news that a giant panda called Pan Pan sadly expired during one of my goal-meeting days.
Of course, these query results can be published, shared, saved, explored and so on just like we saw previously.
Now, that’s a silly example but the idea of, not only being able to download open data, but have subject matter experts combine and publish useful data models as a one-time effort for data-consumers to use in future is an attractive feature. Together with the ability to upload documentation, images or even analytical notebooks you may see how this could become an invaluable resource of data and experience – even within a single organisation, let alone as a global repository of open data.
Of course, as with most aggregation or social sites, there’s a network effect: how useful this site ends up being depends on factors such as how many people make active use of it, how much data is uploaded to it and what the quality of the data is.
If one day it grew to the point was the default place to look for public data, without becoming a nightmare to find those snippets of data gold in amongst its prospectively huge collection, it would potentially be an incredibly useful service.
The “nightmare to find” aspect is not a trivial point – there are already several open data portals (for instance government based ones) which offer a whole load of nice datasets, but often it is hard to find the exact content of data at the granularity that you’re after even when you know it exists – and these are on sites that are often quite domain-limited which in some ways makes the job easier. At data.world there is already a global search (which includes the ability to search specifically on recency, table name or field name if you wish), tags and curated collections which I think shows the site takes the issue seriously.
For analyst confidence, some way of understanding data quality would also be useful. The previews of field types and contents are already useful here. Social features, to try and surface a concept similar to “institutional knowledge”, might also be overlaid. There’s already a basic “like” facility. Of course this can be a challenging issue for any data catalogue that, almost by definition, needs to offer upload access to all.
For browser-haters, it isn’t necessary to use the site directly in order to make use of its contents. There’s already an API which gives you the ability to programmatically upload, query and download data. This opens up some interesting future possibilities. Perhaps, if data.world does indeed become a top place to look for the data of the world, your analytics software of choice might in future include a feature such that you can effectively search a global data catalogue from the comfort of your chart-making screen, with a 1-click import once you’ve found your goal. ETL / metadata tools could provide a easy way to publish to the results of your manipulations, and so on.
The site is only in preview mode at present, so it’s not something to stake your life on. But I really like the concept and the execution so far is way beyond some other efforts I’ve seen in the past. If I find I’ve created a public dataset I’d like to share, I would certainly feel happy to distribute it and all supporting documents and queries via this platform. So best of luck to data.world in the, let’s say,”ambitious” mission of bringing together the world’s freely available – yet often sadly undiscoverable – data in a way that encourages people to actually make valuable use of it.

I know this is an odd question, but how did you export that Fitbit data?
LikeLike
Hi –
I’m afraid I don’t 100% remember, but I think it was probably a manual export from Fitbit.com, as detailed at https://help.fitbit.com/articles/en_US/Help_article/1133
I know in the past I have also used a Tableau web data connector in conjunction with Fitbit, I think from: https://data.theinformationlab.co.uk/fitbit.html – but that’s a bit of a roundabout way if you are after a data export.
Hope that helps – Adam
LikeLike
It does, thank you.
LikeLike