This blog returns back from the dead (dormant?) with a quick note-to-self on how to do something that sounds simple but proved slightly complicated in practice, using Tableau.
Here’s a scenario, although many others would fit the same pattern. Imagine you have a business that is subscription based, where people can subscribe and cancel whenever they wish. Whilst subscribed, your customer can buy products from you anytime they want. They can’t buy products if not subscribed.
What you want to know is, for a given cohort of subscribers, how many of those people who are still subscribed purchased a product within their first, second…nth month?
So we want to be able to say things like: “out of the X people that started a subscription last year, Y% of those who were still subscribed for at least Z months bought a product in their Zth month”.
It’s the “who were still subscribed” part that made this a little tricky, at least with the datasource I was dealing with.
Here’s a trivially small example of what I had – a file that has 1 row per sale per customer.
| Subscriber ID | Length of subscription | Month of subscription | Transaction type |
|---|---|---|---|
| 1 | 5 | 1 | Sale |
| 1 | 5 | 2 | Sale |
| 1 | 5 | 3 | Sale |
| 2 | 7 | 1 | Sale |
| 2 | 7 | 6 | Sale |
| 3 | 1 | 1 | Sale |
| 4 | 8 | 1 | Sale |
| 4 | 8 | 2 | Sale |
| 4 | 8 | 4 | Sale |
| 4 | 8 | 5 | Sale |
| 5 | 1 | Sale | |
| 5 | 2 | Sale | |
| 5 | 3 | Sale | |
| 5 | 8 | Sale | |
| 5 | 9 | Sale |
For simplicity, let’s assume every customer has at least one sale. The columns tell you:
- the ID number of the subscriber
- the length of the subscription from start to finish, in months. If the length is blank then it means it’s still active today so we don’t know how long it will end up being.
- the month number of the product sale
- a transaction type, which for our purposes is always “sale”
Example interpretation: subscriber ID 1 had a subscription that lasted 5 months. They purchased a product in month 1, 2 and 3 (but not 4 or 5).
It’d be easy to know that you had 5 people at the start (count distinct subscriber ID), and that you had 2 transactions in month 3 (count distinct subscriber ID where month of subscription = 3). But how many of those 5 people were still subscribed at that point?
Because this example is so small, you can easily do that by eye. You can see in the data table that we had one subscription, ID 3, that only had a subscription length of 1 month. Everyone else stayed longer than 3 months – so there were 4 subscriptions left at month 3.
The figure we want to know is what proportion of the active subscribers at month 3 bought a product. The correct answer is the number of subscriptions making a product purchase at month 3 divided by the number of subscriptions still active at month 3. Here, that’ s 2 / 4 = 50%.
So how do we get that in Tableau, with millions of rows of data? As you might guess, one method involves the slightly-dreaded “table calculations“. Layout is usually important with table calculations. Here’s one way that works. We’ll build it up step by step, although you can of course combine many of these steps into one big fancy formula if you insist.
Firstly, I modified the data source (by unioning) so that when a subscription was cancelled it generated a “cancelled subscription” transaction. That looked something like this after it was done.
| Subscriber ID | Length of subscription | Month of subscription | Transaction type |
|---|---|---|---|
| 1 | 5 | 1 | Sale |
| 1 | 5 | 2 | Sale |
| 1 | 5 | 3 | Sale |
| 1 | 5 | 5 | Cancelled subscription |
| 2 | 7 | 1 | Sale |
| 2 | 7 | 6 | Sale |
| 2 | 7 | 7 | Cancelled subscription |
| 3 | 1 | 1 | Sale |
| 3 | 1 | 1 | Cancelled subscription |
| 4 | 8 | 1 | Sale |
| 4 | 8 | 2 | Sale |
| 4 | 8 | 4 | Sale |
| 4 | 8 | 5 | Sale |
| 4 | 8 | 8 | Cancelled subscription |
| 5 | 1 | Sale | |
| 5 | 2 | Sale | |
| 5 | 3 | Sale | |
| 5 | 8 | Sale | |
| 5 | 9 | Sale |
Note there’s the original sales transactions and now a new “cancel” row for every subscription that was cancelled. In these transactions the “month of subscription” is set to the actual month the subscription was cancelled, which we know from the field “Length of subscription”
Here are the formulae we’ll need to work out, for any given month, how many people were still active, and how many of those bought something:
- The total count of subscribers in the cohort:
Count of distinct subscribers in cohort{ FIXED : [Count of distinct subscribers]} - The number of subscribers who cancelled in the given month:
Count of distinct subscribers cancellingCOUNTD( IF [Transaction type] = "Cancelled subscription" THEN [Subscriber ID] ELSE NULL END )
- Derived from those two figures, the number of subscribers who are still active at the given month:
Count of subscribers still activeAVG([Count of distinct subscribers in cohort]) - (RUNNING_SUM([Count of distinct subscribers cancelling])- [Count of distinct subscribers cancelling])
- The number of subscribers who made a purchase in the given month:
Count of distinct subscribers making purchaseCOUNTD( IF [Transaction type] = "Sale" THEN [Subscriber ID] ELSE NULL END )
- Finally, derived from the last two results, the proportion of subscribers who made a purchase as a percentage of those who are still active
Proportion of distinct active subscribers making purchase[Count of distinct subscribers making purchase] / [Count of subscribers still active]
Let’s check if it the logic worked, by building a simple text table. Lay months on rows, and the above formulae as columns.
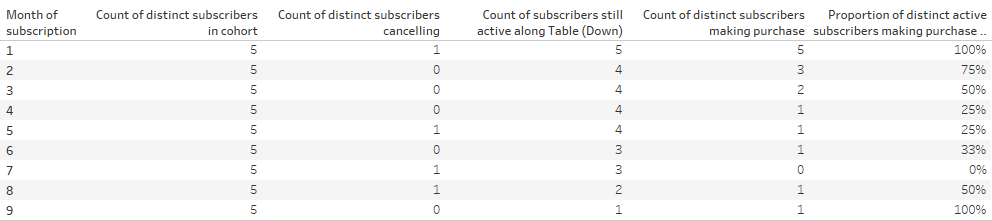
That seems to match expectations. We’re certainly seeing the 50% of actives making a purchase on month 3 that were manually calculated above.
Plot a line chart with month of subscription on columns and proportion of distinct active subscribers making purchase on rows, and there we have the classic rebased propensity to purchase curve.

(although this data being very small and very fake makes the curve look very peculiar!)
Note that we first experimented with this back in ye olde days of Tableau, before the incredible Level Of Detail calculations were available. I have found many cases where it’s worth re-visiting past table calculation work and considering if LoD expressions would work better, and this may well be one of them.
