Time to test yourself! Give the below three questions a go, before proceeding.
- If you toss a fair coin twice, what is the probability of getting two heads?
Here are your options:- 15%
- 25%
- 40%
- 50%
- 75%
- Other
- Don’t Know
- Suppose you roll a 6-sided die. The rolls are: 1, 3, 4, 1, and 6. What is the mean value?
- …and what is the mode value?
- Suppose there was a diagnostic test for a virus. The false-positive rate (the proportion of people without the virus who get a positive result) is one in 1,000. You have taken the test and tested positive. What is the probability that you have the virus?
- 99.90%
- 99%
- 1%
- 0.01%
- Not enough information to know
- Don’t know
These were the questions answered by 101 British MPs via an online survey conducted by Savanta ComRes between November 2021 and January 2022. You can download a spreadsheet with the full results here. It was done on behalf of the Royal Statistical Society who wrote a summary of the results in their news section. If you take a look at some of the headlines issued as a result by the national news media – for example “Statistical ignorance is a pandemic among MPs” – you can perhaps tell it didn’t go all that well.
Let’s look at the first question: “If you toss a fair coin twice, what is the probability of getting two heads?”.
The actual answer is 25%. If this isn’t intuitive to you, then a common way to figure out these type of joint probability problems that only have a few potential outcomes is using a tree diagram. Here’s an appropriate one courtesy of a dummies.com article on the use of probability trees.
Basically, you start at the left and enumerate the possibilities of the first coin toss – heads or tails, which on a fair coin, would each happen half of the time. Label the each branch of the tree with the probability that it gets followed.
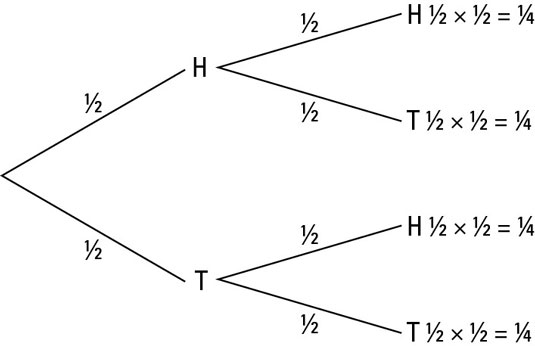
Then you continue the tree from each possible outcome of the first coin toss by enumerating the probabilities of the second coin toss. Again this is 50:50; what you get on the first toss doesn’t affect the second one. If you got heads on your first flip, it’s still the case that half the time you’ll get heads for the second, and half the time tails. Label the branches accordingly!
For any overall outcome (HH, HT, TH, TT) you can then use the general multiplication rule to calculate the probability of the outcome of two independent things as being the probability of the first multiplied by the probability of the second. In tree form, that’s starting at the left, following the relevant branches, and multiplying the probabilities together. So for this example: 0.5 * 0.5 = 0.25, or 25%.
So how many MPs got this answer correct? About half. 52% to be exact.
Based on the RSS writeup , there wasn’t a great deal of difference based on political party; 53% of the Labour respondents got it vs 50% of Conservatives. MPs for the Midlands and the North did better than others, and those who had been in power longer did better on average. Naturally, dividing up respondents into categories like this results in smaller samples with more uncertainty, so further tests would need to be done to establish whether these differences are likely “real” or a product of random chance in sampling.
In the nearly half of the responses where the politicians got the answer wrong, the most common answer given was 50%. That was the answer provided by around a third of the MPs overall.
On the subject of averages, let’s move on to question 2. What is the mean value of 1, 3, 4, 1 and 6? The mean, commonly referred to as the average, is calculated by summing the answers and dividing by the number of answers.
1 + 3 + 4 + 1 + 6 = 15.
15 / 5 = 3
So the answer we’re looking for is 3.
Here the politicians did a little better, with 64% getting the answer right.
Almost the same proportion, 63%, also correctly said that 1 was the mode. The mode is the most common value in the list, so as 1 was the only number that featured more than once in the dice roll results given, it’s that.
Finally, question 3: “What is the probability that you have the virus?”.

One can’t help but notice the word “virus” in this one. It’s a very pandemicy question, right? The topic of tests and interpreting the results has been infused into the country as a whole for the past couple of years or so thanks to Covid-19. The Government routinely publishes the results of Covid-19 tests, and no doubt innumerable policy decisions have used those as input.
In any case, the correct answer is “Not enough information to know”. The question only gives you the false positive rate of the test. In order to calculate how likely it is that you do have the virus after registering positive on a test that can produce false positives, you also need to know another couple of statistics. Also important are the background rate of being infected i.e. how much of it is floating around in society as a whole, and the likelihood that if you do actually have the virus the test will correctly give you a positive result; the true positive rate.
You can perhaps get an intuition for this by considering two scenarios – a world in which the virus has only infected 0.1% of the population and a world in which the same virus infected 99.9% of the population. If you test positive on a test with a one in a thousand false positive rate when you haven’t come within 100 miles of anyone with the virus then it’s less likely that you have the virus than if you test positive after being constantly surrounded by contagious folk. Likewise if the test almost always gets it right that you have the virus when you actually do, then you’re more likely to have it when you test positive than if half the time the test would incorrectly read negative in that scenario.

This article from the Guardian explains the math in more depth and its relationship to a formula known as Bayes’ Theorem. It’s usually written out as “P(A|B) = (P(B|A)P(A))/P(B)” which may look somewhat scary at first, especially if you haven’t had cause to think about formal probability in a while, but is potentially relevant to a whole array of real life decisions, and most definitely a wonderful tool for any data analyst to understand.
Anyway, I’m sure you’re dying to know how many of the polled politicians got this one right. Here it was just 16%. By far the most popular answer given was 99.90%, selected by just over half of the respondents. Out of interest, the “don’t knows” were another 16%.
This post isn’t supposed to be a “haha look how stupid MPs are lol” comment, honestly, tempting as it is at times.
Presented in context, things may be looking up. Back in 2011, an Ipsos in-person survey asked 125 UK MPs – not the same individuals as in the more recent survey of course – the first question, about the chances of getting two heads in two coin tosses, again. At that point just 40% gave the correct answer vs 52% in the more recent study.
On the surface that’s a definite improvement, although per a RSS “Behind the numbers” article, we must always bear in mind the sampling uncertainty for a relatively small survey. They calculated the 95% confidence intervals for the proportion of MPs giving the correct answer to the coin question using the Sison-Glaz method to be 30 – 51% for the 2011 survey, and 41% – 61% for the 2021 assessment, which indicates we can’t be entirely certain that the improvement is a fundamental change.
I did note that the phrasing of the coin question appears to have been a little different between studies too, which is often a red flag for interpretation. The recent survey asked “If you toss a fair coin twice, what is the probability of getting two heads?”, whereas the 2011 seemed to ask “If you spin a coin twice, what is the probability of getting two heads?”.
Spin vs toss doesn’t feel like a particularly likely cause of major differences to me – the only way I can think to interpret the question in either case would lead to the same answer. I suppose the 2011 version didn’t specify a “fair” coin, but one would imagine that’d be the default assumption! In any case, the popular incorrect answer was the same in both versions, which is likely a point of reassurance that the questions were read similarly.
Another point of comparison is that of the general public. In 2010, Ipsos had also asked around 1,000 members of the British public aged 16-64 the same coin question. In that case, 30% of respondents gave the correct answer, i.e. 10 percentage points lower than the MPs. Although I would caution that the “general public” sample is quite different sample to the MPs sample – we don’t have much of a tradition of electing 16 year old MPs in the UK – so I wouldn’t say it’s an very fair comparison.
Nonetheless, I don’t feel compelled to let either the improvement over time or the very debatable benchmark against the Great British public let our MPs entirely off the hook though. After all, they are not random members of the public.
For one, they’ve generally had a far more privileged, expensive and extensive education than the average citizen. Some figures on the makeup of Parliament in 2019 from the Sutton Trust reported that MPs were more than 4 times as likely to have gone to (fee-paying) private schools than the current UK school population at the time: 29% vs 7% respectively. This figure was particularly high for the MPs of the current party in power, with 41% of Conservative MPs having come through this route. Out of the remainder, MPs were more than 3 times more likely to have gone to selective State schools than the public at large – 16% of the total elected MPs vs 5% of the current school population.
Differences are equally as stark when it comes to higher education, with 88% of MPs having attended a university, vs just 19% of the general working age population at the time.
But perhaps more importantly they’re a self-selected group of people whose job is to make decisions that affect every inhabitant of the UK, along with a lot of extremely international consequences. In today’s world I’d imagine a great many of these life-or-death decisions benefit from analytical inputs. Almost every government report I can remember browsing talks about counts, averages and proportions. And that’s even before Covid-19, a situation where at times we’ve seemingly had little except statistics to guide us through one of the biggest crises in living memory. Even to the extent that the population was encouraged to watch TV briefings laden with statistics including challenging concepts such as logarithmic scales. We all became familiar with flattening the curve.

This version was taken from an animated explanation published by Statnews.
Of course, each individual politician can’t be expected to be good at everything. Perhaps we should discuss what a reasonable baseline would be. But in any case there’s also a damaging lack of epistemic humility from their quarters on occasion.
Of course, the archetypical politician with this flaw comes from across the Atlantic, Donald Trump, the self-acclaimed greatest expert in anything anyone ever imagined. But extremes aside, local big-hitters such as Michael Gove are famous over here for making comments to the effect of that the public has had enough of experts. Inevitably, a later study suggested that there was in fact no evidence that the public has had enough of experts.
It’s one thing to not know the answer to a question, but it’s quite another to think you do when you actually don’t – and it’s a whole different ball-game when you’re actively opposed to asking the people who probably do know the answer.
It’s perhaps interesting that in stats questions 1 and 4 above, those who got it wrong were more likely to give a wrong answer than say they didn’t know the answer. And this was in a survey where no-one was going to know what answer you gave, which seems like a safer domain to admit ignorance in than, say, Newsnight. Of course I can’t say to what extent the respondents actually knew they didn’t know the answer. We all think we know things that later turn out to be false.
Interestingly this wasn’t the case for questions 2 and 3, the ones asking for the mean and mode of the dice rolls. This adds to my curiosity around whether the wording of that question was a little obtuse. Had the question asked for the average and the most common dice roll, would we have seen a more accurate response? My evidence-free intuition would be that we would have, especially on the latter. If so, that’s a lesson for people in my line of work: present your work using words that normal humans are likely to understand.
Us data analysts can also learn lessons from the exercise as a whole. To attempt some personal epistemic humility, honestly I would have very much overestimated the number of MPs who knew the answers to the two coins question. Before reading these results, I’d have probably put it at around 85-90%, and the general population at say 65%.
Likely, this is 1) because the answer to those types of questions are familiar to me personally; and 2) because most days I speak to other data analysts, people in my orbit are extremely likely to also be able to work it out – the classic filter bubble.
I’ve no doubt that somewhere out there are groups of people would be amazed to learn I don’t have a clue how modern cars actually work, and wouldn’t be able to tell the difference between a real and a fake Picasso. We all have different areas of expertise, and it’s very easy to think that we ourselves know is the default state of knowledge for each human we come across.

Nonetheless, there should be some responsibility both on the parts of people who want to hold extremely prestigious positions that routinely require making incredibly important decisions based on quantitive data – as well as for those that grant them that power – to find a path towards ensuring that they understand how to make sense of the inputs to those decisions.
If nothing else, it’d be great to get to the point where the group of people who produce the rules about whether and how we should use lateral flow tests in order to save lives have a reasonable sense of what the results of a lateral flow test actually mean.

2 thoughts on “Are you (statistically) smarter than a politican?”